Quantcast
Channel: Developer Express Inc.
Viewing all 2417 articles
Browse latest View live

Known Issues in .NET Core Tools (preview 2) for Visual Studio and Workarounds

$
0
0

Since releasing the DevExtreme ASP.NET MVC Wrappers for ASP.NET Core, we've seen some issues with the Visual Studio 2015 Tooling Preview 2 (for .NET Core 1.0).

Below are three issues with workarounds that could help you. Please keep in mind that many of the issues are likely related to the tooling software being in 'preview' mode. Microsoft is aware of most of these issues and they will likely address them in a future release.

Three known issues and workarounds

The following issues relate to ASP.NET Core projects (both .NET Framework and .NET Core):

1. Bower search dialog cannot find packages

This issue occurs when bower in Visual Studio can find a package but not install it. Take a look at the details here: aspnet/Tooling#506. This is a known issue which means it may be addressed in a future build.

Workaround

Edit the bower.json file manually. If bower.json is missing, enable 'Show All Files' in the Solution Explorer toolbar.

DevExtreme ASP.NET MVC Wrappers - ASP.NET Core - Project Template

Then add your packages directly to bower.json and run the 'Restore Packages' command.

2. Bower may install wrong versions of packages

If git.exe is not available in your local PATH, then Bower may install the wrong versions of packages.

Yes, this is an unpleasant issue where the symptoms may include:

  • missing JavaScript files
  • various JavaScript runtime errors
  • messages about using incompatible libraries

Luckily, Microsoft is aware of the issue which you can also track here: aspnet/Tooling#575. And there is a StackOverflow discussion too: http://stackoverflow.com/a/38460014

Solution:

  1. Install Git for Windows
  2. Delete your local bower directory: %USERPROFILE%\AppData\Local\bower
  3. Restart Visual Studio
  4. Delete wwwroot/lib
  5. Restore bower packages

3. DevExtreme ASP.NET Core project templates fail to restore packages

This issue appears as the yellow error bar at the top of Solution Explorer:

DevExtreme ASP.NET MVC Wrappers - ASP.NET Core - Restore Packages Error

Workaround

We've found a workaround for this issue and fixed it in the DevExtreme v16.1.6 release.

If you don't have v16.1.6 yet, then you can use this simple workaround: invoke package restore manually ("Restore Packages" item in the context menu of project node in Solution Explorer)

Also, this issue will likely be solved in Visual Studio tooling when the .NET Core projects are switched from project.json to csproj/MSBuild. Microsoft is aware of this issue as well.

Try DevExtreme Components for ASP.NET Core today!

Download DevExtreme v16.1.6 and let me know your thoughts about ASP.NET Core in the comments below. Thanks!

Keep in mind that the Visual Studio tooling (for .NET Core) is still in preview. We are sure that Microsoft will address the issues and provide the best environment to build .NET Core apps.

Leave me a comment below or email me: mharry@devexpress.com

Twitter: @mehulharry


Your Next Great .NET App Starts Here

Year after year, .NET developers such as yourself consistently vote DevExpress products #1.

Experience the DevExpress difference for yourself and download a free 30-day trial of all our products today: DevExpress.com/trial (free support is included during your evaluation).


CodeRush for Roslyn – Setup Wizard

$
0
0

Everyone is different. Everyone has their own preferences and their own approach.

If you’ve never used CodeRush before (or even if you have) its a good idea to use our new setup wizard to configure things at a high level, before diving into your next coding session.

The wizard will give you the chance to set base settings for several of our main features, so that they behave the way you’d like them to. There is no requirement to use the wizard, but we feel that doing so will improve your CodeRush experience greatly.

So what can you configure using the wizard?

Structural Highlighting

CRRSetupWizardStructuralHighlightingWhat is it?
Structural highlighting is where CodeRush lines are drawn between the start and end of various different types of block. This helps make sense of what is commonly called arrow code (Code which is heavily nested in successive blocks of different type). By using different colors to show the the blocks of ‘properties’, ‘accessors’, ‘foreach loops’, ‘conditional blocks’, ‘switch statements’ and ‘exception handling blocks’, CodeRush makes it much easier to determine very quickly where each of these start and end.

What can I configure?
The wizard options here are simple: Would you like Structural highlighting on, or off?

What if I need more?
The ‘Editor\Painting\Structural Highlighting’ section of our options screen (Ctrl+Alt+Shift+O) will let you change which block types are linked, their color and style.

Numeric Keypad Bindings

CRRSetupWizardNumericKeypadWhat is it?
Put simply this option causes CodeRush to assign a few additional shortcuts to the keys of your numeric keypad. This keypad goes unused by the majority of people and this option will reclaim several of it’s keys for quick access to some of our more popular functions.

Which shortcuts will be added?
Num-Plus - Selection Increase - Increase your code selection in logical block rather than character by character.
Num-Minus - Selection Decrease - Reverse the effects of ‘Selection Increase’ by similar logical blocks.
Num-Period – Jump to Menu –  Our general purpose go-to navigation menu (Full details here)
Num-Enter – Jump to Symbol– Our Symbol-specific navigation menu (Full details here)
Num-Zero – Code / Refactor Menu– The ever popular CodeRush/Refactor key. Quick access to all the Refactorings and CodeProviders suited to your current context.

These shortcuts involve fewer keystrokes than their default equivalents. They are also typically easier to hit given their increased size and useful location.

Spell Checker

CRRSetupWizardSpellCheckerWhat is it?
As you might expect, CodeRush’s Spell Checker is the simple ability to check the spelling of certain specified parts of your document. It is disabled by default but can be enabled from the wizard in any of 3 ways.

What can be checked?
This screen lets you enable spell checking for 3 distinct parts of your code: Comments, Strings and API-level Members and Identifiers.
(For our purposes, API-Level members and identifiers are those that are public, protected or internal )

What if I need more?
These settings can be tweaked and fine-tuned on our options screen (Ctrl+Alt+Shift+O) within the ‘Editor\Spell Checker’ page.
From here you can specify more locations to check, filter others out and specify the dictionary you’d like to use.

Tab to Next Reference

CRRSetupWizardTabToNextReferenceWhat is it?
Tab to Next Reference is the ability to place your caret within an identifier (method, variable, method) and hit Tab to initiate navigation between all the references to that identifier. I find this one as least as useful as the built in Go To Definition (F12)

Any other associated shortcuts?
Yes. Shift+Tab will carry you back through your references in the reverse direction, and once you are finished navigating through the references, you can hit Esc (or Alt+End) to return directly to your start point via a hidden marker.

This has to be one of the the easiest way to navigate through your code.

Smart Semi-Colon

CRRSetupWizardSmartSemiColonWhat is it?
Intelligently repositions your caret when you hit the semi-colon key, so that the semi-colon is emitted in the most sensible location.

Why would I need that though?
Consider features like the auto-completion of braces and parenthesis. These features are great because they finish what you start, so that you don’t have to. They leave your caret where it is, enabling you to continue working on your inner code.
A few method calls later, and you are potentially buried in parenthesis. Smart semi-colon is a simple but effective feature which allows you to hit the semi-colon without digging yourself out from under the parenthesis mountain first.

CodeRush will determine where the semi-colon should go, and position your caret there first before emitting the character.

One Key Selection Embeddings

CRRSetupWizardOneKeySelectionEmbeddingWhat is it?
Selection Embeddings are best described as CodeRush Templates that envelop your selected code.
A One-Key Selection Embedding is one which is triggered by the pressing of a single key. You select your code and then hit a trigger key. Instead of replacing the selected code with the key, the code is wrapped in text according to which embedding was invoked.

CodeRush provides several out of the box.

C– Wrap code in Try..Catch
F– Wrap code in Try…Finally
T– Wrap code in Try…Catch…Finally
B
– Wrap code in a set of braces. { … }

 Code Template Expansion

CRRSetupWizardTemplateExpansionWhat are CodeRush Templates?
Often described as VS snippets on steroids, CodeRush Templates are short sequences of characters which generate more verbose text within the editor. Templates can be used to create methods, classes enumerations, block constructs, unit tests, test assertions and much more.

What can I configure?
On this page of the wizard, you’ll decide how Templates will be triggered.

Personally I like to pick the Space key for maximum speed and ease of activation (After all that space bar is nice and big and easy to hit). Others pick the Tab key in order to reduce the risk of accidental template expansion. You can also elect to disable the template system from this page.


Markers

CRRSetupWizardMarkersWhat are Markers?
Markers are your virtual breadcrumbs. They are like stack based transient bookmarks in your code.

Why would I need another kind of bookmark?
So your coding along. Everything is going well, when you realise that you need to check something. Drop a marker. (Alt+Home) to mark your place and go investigate whatever you feel like. When your done, hit a single key (Esc or Alt+End) and return not just to when you were previously, but to the exact frame of reference you had before.

Markers stack, which means you can drop as many as you like digging deeper and deeper into your code. When you’re ready, you collect them in reverse order (just like virtual breadcrumbs) leading you back to where you started.

CodeRush will drop additional markers when you navigate away from where you are. Go To Definition (F12), Go To Symbol (Ctrl+Shift+Q or Num+Enter) or Jump To (Ctrl+Alt+N) will all drop markers allowing you to navigate away to investigate something and then hit Esc to return once you’re done.

What can I configure?
On this page you can decide if you’re like to enable Markers and further which shortcut you’d like to use to collect them.

Note: Since VS2013, Visual Studio has altered it’s behaviour when navigating. Following jumping to an identifier’s declaration (F12), Visual studio selects the name at that declaration assuming that you want to do something with its name. This means that those have grown used to using Esc to collect markers have had to press Esc once to remove the selection and once more to collect the marker. You can opt to let CodeRush work around this behaviour by choosing the last option on this page of the wizard. 

We highly recommend choosing the final option for your marker configuration in order to make your navigation experience as smooth as possible.

IntelliRush

CRRSetupWizardIntelliRushWhat is it?
IntelliRush is the CodeRush version of IntelliSense.
It does every thing normal intellisense does, and more.

What extras do I get with IntelliRush?
You can Resize IntelliRush. Just grab the edge and expand your view.

You can filter content by member type: Restrict content to only Events, Properties or Extension methods (or something else) to quickly find the exact member you’re after.

You can filter content by hierarchy: Restrict content to a specific level of the hierarchy. Show only members declared on the class of the object being inspected, or choose another ancestor and show only members declared on that ancestor.

All filtering achievable using simple on-screen keystrokes whilst losing none of the power of intellisense.
 

Menu

CRRSetupWizardMenu

The preferences you set in the Setup wizard are not permanent. You can return to the Wizard and change any of your choices at any time. Just open the ‘CodeRush’ menu and choose the ‘Setup Wizard’ option to begin amending your choices.

The choices you make within the wizard have been chosen to get you up and running as quickly as possible. However there is a lot more customization available via our main Options screen also available from the ‘CodeRush’ menu or via the Ctrl+Shift+Alt+O shortcut.


Everyone is different and we all have our own preferences and approach. It is our hope that the minimal amount of configuration requested by our Setup Wizard, will greatly improve your CodeRush experience.

CodeRush for Roslyn is now available for as little as $50 a seat and a 30 day trial can be found in the Visual Studio Gallery.

Dashboard v16.1: Data-Bound Images and Mail-Merge Text Box

$
0
0

The features discussed in this post are illustrated in the Product Details demo, specifically on its left-hand side. Try changing the master filter using the Products dropdown list, and notice how the mail-merge text box and the images below it are automatically updated.

Both features - mail merge in text box and data-bound images - have been introduced in v16.1. To enable them, first make sure that the data source's DataProcessingMode is set to Client (we are working on removing this limitation in future versions). Then follow the instructions below.

Data-Bound Images

Dashboard v16.1 introduced a new element - Bound Image. As the name suggests, you can specify a data field that supplies values to this element, and the Options dialog will help you specify if the fetched values are treated as:

  • Byte arrays, i.e. actual image data.
  • Alphanumerical values that help specify a path to the image. In this case, you'll need to set up a path template with a field value placeholder.

Dashboard - Data Bound Image

Mail Merge in Text Box

The Mail Merge feature became available in the previously existing Text Box element. Simply drop the required fields into the Values section and then use the Insert Field command in the edit mode, thus embedding dynamically-updated database values into the static document.

Dashboard - Mail Merge Text Box


Use these features to enrich your dashboard with textual and image details that depend on the current context. Speaking in Dashboard's technical terms, that "context" is defined by the static item filter and dynamic master filter.

We certainly hope that the described UI is clear and self-explanatory and if you think we're missing anything, do let us know in the Comments section below.

How to Open a Microsoft Office Document with DevExpress ASP.NET Office Controls

$
0
0

Getting started with the DevExpress ASP.NET Office Controls is easy. In a few of the upcoming blogs, I'll highlight some of the common getting started tasks with DevExpress ASP.NET RichEdit and Spreadsheet controls.

One of the first things you'll likely want to do after adding a DevExpress ASP.NET Office control to your web project is to open a document.

File System or Database

There are two ways to load a document into a DevExpress ASP.NET office control. You can use the file system or load it from document storage (database).

Note, the code example below reference the DevExpress ASP.NET Spreadsheet control, however, the same code applies to the DevExpress ASP.NET RichEdit control.

Load from File System

The DevExpress Office controls support various formats including docx, csv, pdf, xlsx, and more.

To load or open a document (docx, pdf, xlsx, etc.) using the Server-side API, call the Open method:

void ASPxSpreadsheet.Open(string pathToDocument)

The pathToDocument) parameter represents the full the document path and filename in the File System. The pathToDocument also plays role of the document identifier - the DocumentID.

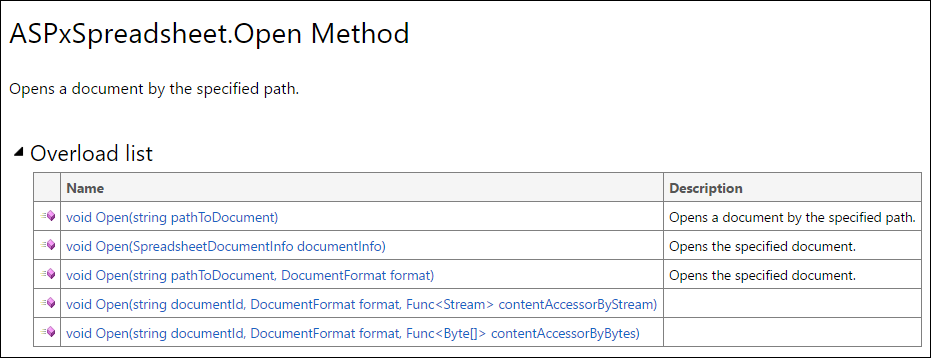
The Open method also provides several overloads:

DevExpress ASP.NET Spreadsheet - Open method

Because these are server-side ASP.NET controls, the file system mentioned above is the one on your web server. End-users can upload a file to the working directory that you specify for the control to use. Then, call the open method and load the corresponding file into the DevExpress ASP.NET Office control.

Take a look at this 'Custom Document Management' demo which has integrated the versatile DevExpress ASP.NET File Manager control. The File Manager control gives your end-users a visual layout of the server-side file system and allows them to upload files too.

Load from Document Storage (Database)

To load a document from the database, the DevExpress Office Controls provide stream and byte array parameters in the Open method:

void ASPxSpreadsheet.Open(string documentId, DocumentFormat format, Func<Stream> contentAccessor)

void ASPxSpreadsheet.Open(string documentId, DocumentFormat format, Func<byte[]> contentAccessor)

Let's take a look at the parameters needed to retrieve a file (aka binary object) from your database.

DocumentID

The DocumentID parameter is simply a unique string and is used to load and save documents. The DocumentID is necessary when dealing with ASP.NET documents programmatically.

If you've previously saved your DocumentID parameter to the database then you can use this ID for the open method.

Or you can also generate a new unique ID using the following approach:

private void CustomDocumentOpening() {
    var newUniqueDocumentId = Guid.NewGuid().ToString();

DocumentFormat

The DocumentFormat specifies the file format you want to open (xlsx, docx, etc.).

Load Blob from Database

After getting your DocumentID, you'll need to write some custom code that extracts the document (binary object) from your database.

For example, here is how to retrieve it via a stream:

    // Open document from content in stream
    using(var stream = GetStreamFromCustomDocumentStorage()) {
        ASPxSpreadsheet1.Open(newUniqueDocumentId, DocumentFormat.Xlsx, () => stream);
    }
}

private FileStream GetStreamFromCustomDocumentStorage() {
    throw new NotImplementedException();
}

And here is how to retrieve it via a byte array:

    // Or, open document from content in byte array
    byte[] documentContentAsByteArray = GetByteArrayFromCustomDocumentStorage();
    ASPxSpreadsheet1.Open(newUniqueDocumentId, DocumentFormat.Xlsx, () => documentContentAsByteArray);

    // TODO save somewhere the newUniqueDocumentId if needed
}

private byte[] GetByteArrayFromCustomDocumentStorage() {
    throw new NotImplementedException();
}

Once the document is retrieved from the database, it can be passed to one of the open method overloads as a Stream or array of bytes (along with the DocumentID and DocumentFormat).

Feedback

I would love to hear your feedback on the DevExpress ASP.NET Office Controls.

Leave me a comment below or email me directly: mharry@devexpress.com

Thanks!


Your Next Great .NET App Starts Here

Year after year, .NET developers such as yourself consistently vote DevExpress products #1.

Experience the DevExpress difference for yourself and download a free 30-day trial of all our products today: DevExpress.com/trial (free support is included during your evaluation).

How to add a Chart to your Client-Side PivotGrid (DevExtreme v16.1)

$
0
0

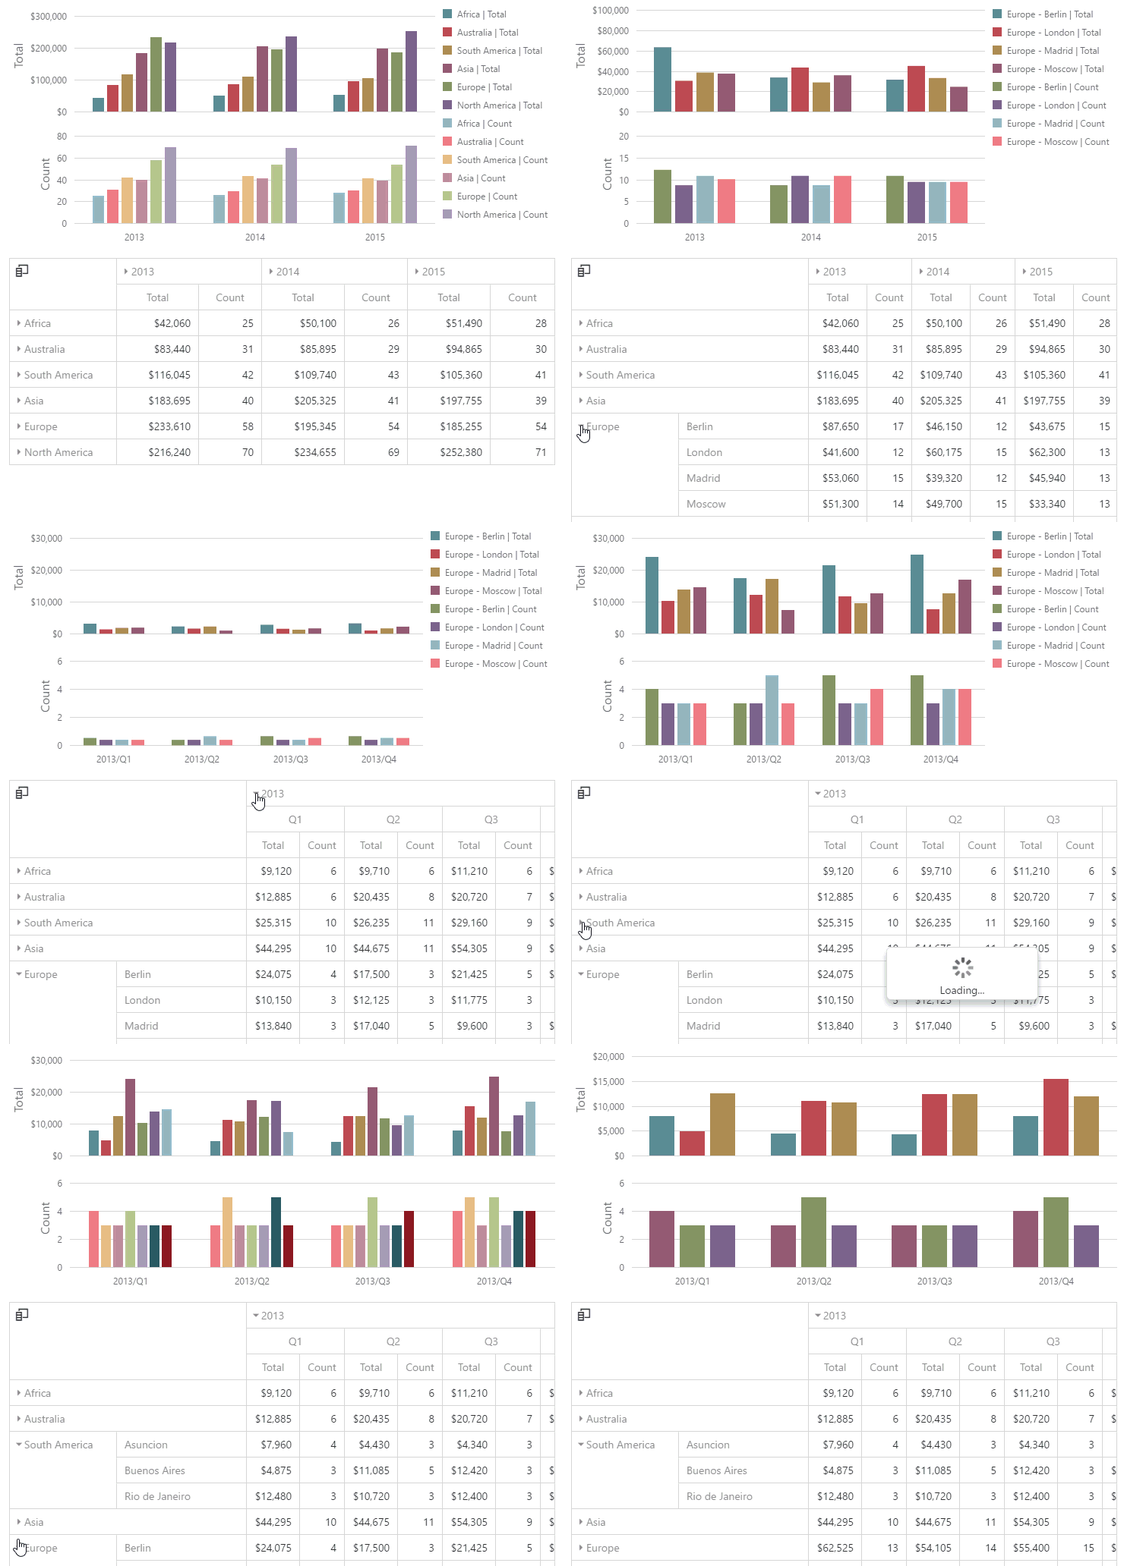
A chart is a great way to visualize data. Did you know that you can easily add a chart to the DevExtreme PivotGrid widget? And the chart will update instantly with the PivotGrid:

DevExtreme Pivot and Chart Integration

In previous versions of DevExtreme (15.2 and earlier), you could display PivotGrid data with a chart but it was very complex and you had to write custom code.

Starting with the v16.1 release, we introduced a new method for chart integration - bindChart.

How does it work?

To integrate the two widgets, first create new instances of PivotGrid and Chart, then call the bindChart method:

var pivotGrid = $("#pivotContainer").dxPivotGrid(...),
      chart = $("#chartContainer").dxChart(...),
      integrationOptions = {...}
pivotGrid.bindChart(chart, integrationOptions);

The bindChart method accepts two arguments: a Chart instance and an object containing integration options. This allows you to adjust data fields, series, value formatting, panes and axes, and many others options.

Try the online demo.

Learn more in the DevExtreme documentation.

This feature is a part of the DevExtreme v16.1 release. Thanks!


Create highly responsive web apps for touch-enabled devices and traditional desktops.

From desktops to mobile devices, DevExtreme HTML5 Data Grid delivers the flexibility you’ll need to build apps that reach the widest audience and deliver touch-first user experiences to power your next great interactive website.

Download a free and fully-functional version of DevExtreme now: Download DevExtreme

TestCafe now available in Free/Open Source & Commercial Studio Versions

$
0
0

TestCafe

Today, I am excited to announce two new TestCafe projects:

  1. TestCafe - An open-source project that is now hosted on GitHub with an MIT license. It's a free and lite version of TestCafe that exposes the core functionality of TestCafe!
  2. TestCafe Studio - Our commercial product that includes the open-source (core) TestCafe framework with the added benefits such as a powerful user interface, a visual test recorder, and full DevExpress support.

Therefore, starting today, we have split TestCafe into a lite (and free) open-source version and the new TestCafe Studio. The current commercial version will officially become TestCafe Studio in early 2017 when we introduce a new desktop-based IDE (more on this below).

And this move has benefits for both the open-source developers and the paid TestCafe customers. Read on to learn more.

Open-source, Free, MIT, FTW!

By open-sourcing TestCafe, it allows more developers and testers to use the excellent functional testing framework in their projects. A free framework with an MIT license will encourage an active open-source community. And an active open-source community of TestCafe users will help contribute code, share and discuss ideas.

TestCafe Studio, which uses the open-source TestCafe framework internally, will be developed faster, be more robust, and gain the features users need the most. TestCafe Studio also comes with full support from DevExpress support engineers.

We will monitor TestCafe on GitHub and our developers will interact with the community. Of course, we'll provide framework updates, take pull requests, and address issues. However, if you need full guaranteed support within a business day, then you will need a TestCafe Studio license.

Node.js

The new open-source TestCafe framework is a native node.js solution. This is great for Nodejs based web applications because you can simply npm install testcafe and get a complete functional testing framework.

And it allows you to run tests from the command line or via the JavaScript API. And you can output Reports to the console or directly to a file.

The framework also has a new test API and syntax, which is compatible with current tests.

TestCafe Studio UI vs Test Cafe CLI

The key difference between the TestCafe Studio and TestCafe open-source framework is the Visual tools. Only TestCafe Studio includes:

  • Visual test recording
  • UI for
    • Launching tests
    • Analyzing test results
    • Managing test base
    • Controlling the remote browsers
    • Settings and configurations
  • Full Support

The free open-source TestCafe framework includes a great CLI (command line interface). Therefore, you can still write the same powerful tests and get the resulting reports. However, they will be through the CLI.

Get started now!

Try the open-source TestCafe:

If you'd like to try the current visual-based TestCafe, then download a free 30 day trial. This TestCafe will soon be renamed as TestCafe Studio and existing customers will be upgraded automatically.

Cross-platform (Desktop) Studio

We're working on a new Commercial version of TestCafe! We expect to release it in the first quarter of 2017.

While the current TestCafe UI is cross-platform, it only runs in the browser. We're working on a new cross-platform desktop application! Yes, a native desktop application for multiple operating systems. And it will have some major features, including:

  • Newly designed IDE-style interface where you can:
    • record
    • write
    • edit and run tests
    • analyze test results
    • manage the test base
    • access all the settings
    • and do everything you can do in the current version and more

Feedback

I would love to hear your feedback about this big TestCafe announcement. Leave me a comment below or email me directly: mharry@devexpress.com

Thanks!


Get Started Today

And experience the TestCafe difference for yourself. Download a free 30-day trial today: testcafe.devexpress.com (free support is included during your evaluation).

CodeRush for Roslyn – Writing Tests Fast

$
0
0

So we’ve proved that CodeRush has the fastest .Net Test runner.

Next up I’m going to show you that CodeRush is also the quickest way to write tests.

Note: For the purposes of this post I’m going to assume that you’ve enabled Templates, and that you are using the Spacebar to trigger their expansion.
If you have not enabled Templates, you can use the setup wizard to do so now.

Writing Tests using CodeRush Templates

So how simple could it possibly be to start writing a new test?

How about t<space> ?

That’s only 2 keys!

Don’t believe me? Ok try this

  • Create a class library and add a reference to your favourite testing framework. I’m going to use NUnit which I’ve added via nuget.
  • Create a new class file and delete everything in it (Keep the namespace if you want.)
  • Choose an empty line and type the letter ‘t’ and then press the spacebar.

You’ll be presented with a new test fixture with the skeleton of a new test.
The name of the Test Fixture is already selected.

  • Change the name of the fixture to whatever you like.
  • Hit [enter] to confirm when you’re happy.

Your selection moves to the name of the test.

  • Change that to whatever makes the most sense to you.
  • Hit [Enter] to confirm once again.

Your caret is repositioned once again within the body of the test that you’ve just created.

This is roughly what you can expect this experience to be like.

 CRR_Testing_TestWithFixture

Effort

If you count the characters I typed (t, [space], M, y, T, e, s, t, S, u, i, t, e, [Enter], M, y, F, i, r, s, t, T, e, s, t, [Enter]) You’ll come to 26 characters.

However 22 of those were the names of my fixture and test, (which we’d have to type no matter what) so really we’re only talking about 4 characters. 2 to generate the frame of the test (and the fixture) and another 2 to confirm we’re happy with what we’ve typed and to move on to the next bit of defining our test.

Whichever way you look at it…. That’s not a lot of effort.

Complexity

How easy or hard was that? Could you do it again? What do we have to remember?

Well we have to remember that the test template is triggered with t and then [space] (or tab if you’ve got your preferences set that way).

That’s literally it.

Context

Things get even simpler when you realise that you don’t always have to learn new template shortcuts for new purposes. CodeRush’s templates are context-sensitive. Which means that the same trigger can yield different expansions under different circumstances giving you even less to learn.

For example, if you invoke the t<space> template from within a test fixture, CodeRush spots that you already have the fixture and only generates a new test.

CRR_Testing_TestWithoutFixture

Assertions

Ok well that was simple. What else can we do?

Well what do you need to do in a test when you get right down to it?

  • You setup a scenario.
  • You assert something about the scenario.

Well your setup will be specific to your needs, but assertions are mostly the same.

So does CodeRush have some tricks to help us assert a little quicker? …  Of course it does Smile

So what sort of things do we typically assert?

Well assertions (and therefore Tests) are all about checking something that should a certain way, and failing  (ie getting the developer’s attention) if that turns out not to be the case.

We assert equality and inequality

If you want to Assert Equality, you use the ae<space> template –>CRRTestingAssertEqual

If you want to Assert Same, you use the as<space> template –>CRRTestingAreSame

If you want to Assert Not Same, you use the ans<space> template –>CRRTestingAreNotSame

…we assert that things are true and false

If you want to Assert True, then you use the at<space> template –>CRRTestingAssertTrue

If you want to Assert False, then you use the af<space> template –>CRRTestingAssertFalse

…and we compare with null

If you want to Assert Null, then you use the an<space> template –> CRRTestingAssertNull

If you want to Assert Not Null, then you use the ann<space> template –>CRRTestingAssertNotNull

As you can see CodeRush has you covered and always with a template that is intuitive and easy to remember.

I’m sure you’re starting to see the benefits of CodeRush templates. I’ll leave you there for now, and let these templates soak in. Just know that no CodeRush templates are hard wired. They can all be altered or tweaked to your needs, and you can even create your own… We’ll explore how to do that in a future post.

If you’d like to try out CodeRush for Roslyn, a 30 day trial can be found here on the Visual Studio Gallery.

CodeRush for Roslyn can be yours for as little as $49

Source Code Now Available for Online Training Courses

$
0
0

We have had numerous requests recently to make the source code that is shown and created in our online video training courses available to customers. I'm proud to announce that we have now made this step!

When you access an individual training video, there is now a button above the player that allows you to download a sample project zip file relevant to that video:


The zip file actually contains two projects in many cases: a starting point and an end point project. For videos where a new project is created from scratch, there is only the end point. Here's what the extracted hierarchy looks like for the WinForms demo about MDI menu and toolbar merging:


The "start" folder contains the solution in the state used at the beginning of the video, and the "final" folder holds the same solution with the changes applied that are demonstrated in the video.

With this structure, you can start from the beginning and reproduce the steps shown in the video, or you can just look at the final version of the code to see the results right away. This is a great added value to our online video classes!

As an additional option, you can download a package containing all video-specific sample projects for a class from a button on the overview page for the class:


Source code is now available for all online video training classes, and if you are a current subscriber, you can find it by accessing your subscribed classes from the Training Center. If you are not a subscriber yet, you can also go to the Training Center to get access today!


Approaching Angular 2 from a WebForms perspective

$
0
0

Sometimes we spend so long working in a technology it is a difficult to make a switch. If it ain’t broke, don’t fix it, right!?  The problem is, the world moves on. Using server side technologies like ASP.NET WebForms is something I still love to do, add a few DevExpress components onto a page, set the properties, bind some data and boom, almost no code and I have a working web application. There are many debates scattered on the internet about WebForms been deprecated, that they are evil, I simply disagree. Now, if you are wanting to target a wider range of web servers and operating systems, use .Net Core, have light weight UI then you would start looking at some of the popular frameworks like Angular 2. Herein lies the dilemma, how does someone with many years experience as a WinForms and WebForms developer make the jump to a client side driven application? I’m pleased you asked…

Julian and I are presenting a webinar on this exact topic on November 3. Specifically we will take an existing WebForms application and create an Angular 2 version using the DevExtreme Web controls.

The goal is to show how a C# (or VB) developer with a background in WebForms can get started in the client side world. As with most of my presentations lately, we will also be using TypeScript.

Take part in the fun by Registering here,  seats are limited.

Impressions from .NET Developerdays Poland

$
0
0

Last week, we where proud to be a gold sponsor of .NET Developer Days in Warsaw, Poland.

John, Ivan, Tatyana and I were manning our booth where we talked with lots of people, handed out T-Shirts and other goodies and gave some cool demos of our products.

Amongst other great sessions, I presented 3 sessions as well.

We like to thank the organizers and attendees for making this such a great event!

Watch the webinar for TypeScript and DevExpress ASP.NET and MVC

$
0
0

Check out the webinar video on how to use TypeScript with DevExpress ASP.NET and MVC controls:

In the video, you'll learn:

  1. A short introduction to TypeScript by our evangelist, Paul Usher.
  2. Then I demonstrate how to get started using TypeScript with DevExpress ASP.NET controls.

I'd love for you to watch the video, try the new DevExpress TypeScript definitions with your DevExpress ASP.NET projects, and then give us your feedback. You can email me, drop me a comment below, or even tweet me.

Thanks!


Your Next Great .NET App Starts Here

Year after year, .NET developers such as yourself consistently vote DevExpress products #1.

Experience the DevExpress difference for yourself and download a free 30-day trial of all our products today: DevExpress.com/trial (free support is included during your evaluation).

PDF Document Processor: Interactive Forms Flattening (Coming soon in v16.2)

$
0
0

PDF documents have become one of the most widely used mediums for filling out forms. Combining elements such as text fields, drop down lists and buttons has made it simple for companies to provide a way to collect information. To ensure the integrity of the data a form can be ‘flattened’, this replaces the interactive fields with regular content such as text, images or shapes.


We are pleased to announce that starting with v16.2, the PDF Document Processor has the ability to perform field flattening.  You can achieve this in one of two ways:


•    Flatten entire form or;
•    Flatten a specific field on the form


To flatten the entire form, you simply need to call the FlattenForm method which returns a Boolean value, false if there are no fields found or true if the process succeeds.

See the code snippet below:

    using (PdfDocumentProcessor processor = new PdfDocumentProcessor()) {
         processor.LoadDocument("Demo.pdf");
         if (processor.FlattenForm())
              processor.SaveDocument("Result.pdf");
    }


If you need to flatten specific fields you can call the FlattenFormField method passing in the name of the field. Again, the result is a Boolean value, false if the field is not found, otherwise true. You can obtain a list of interactive field names in a document by calling the GetFormFieldNames method which returns a string collection.

Let’s look at a code snippet:

    using (PdfDocumentProcessor processor = new PdfDocumentProcessor()) {
         processor.LoadDocument("Demo.pdf");
         // Flatten all form fields with “Address” in their names.
         processor.GetFormFieldNames()
              .Where(name => name.Contains("Address"))
              .ToList()
              .ForEach(name => processor.FlattenFormField(name));

         processor.SaveDocument("Result.pdf");
    }


Don’t forget, there is no way to undo the flattening process, so it would be a best practice to save the document as a different name!


As always, we would love to hear your feedback on this upcoming feature.


Removing DevExtreme widgets from the DOM

$
0
0

I was working on a few samples recently and stumbled upon this problem: when a widget created by our DevExtreme library was removed from the DOM, it wouldn't re-render itself on the same node later on.

Initially I was using code like this to remove child nodes from the target node:

while (node.lastChild) {
  node.removeChild(node.lastChild);
}​

This didn't work and after a bit of debugging, I tried to also reset node attributes that might have been added, in order to restore the target node to its original state:

$.map(node.attributes, a => a.name).
  forEach(n => {
    if (n != "id") {
      node.removeAttribute(n)
    }
  });

However, I was still unable to render a new widget in the same node later on. So the research continued, and with the help of our team I figured out that additional information is stored using the jQuery data() helper, and this also needs to be cleaned up properly. It is a good recommendation to call the _dispose() function on the widget to make sure any internal clean-up is performed at this point. Overall I ended up with this helper function to clean up the target node completely:

function clearNode(node) {
  const chartData = $(node).data("dxChart");
  if (chartData) {
    chartData._dispose();
    $(node).removeData("dxChart");
  }
  const componentData = $(node).data("dxComponents");
  if (componentData) {
    $(node).removeData("dxComponents");
  }

  while (node.lastChild) {
    node.removeChild(node.lastChild);
  }

  $.map(node.attributes, a => a.name).
  forEach(n => {
    if (n != "id") {
      node.removeAttribute(n)
    }
  });
}

I have created a sample that shows the use of this code:

Finally, note that the widgets always store their data in this way, regardless of the library you use to instantiate them. In other words, if you use our Knockout or Angular support, the data is stilled stored using the jQuery mechanism, and you would need similar steps if you were to manually remove a widget from a node.

CodeRush for Roslyn update, version 16.1.8

$
0
0

The 16.1.8 CodeRush for Roslyn update contains important new productivity features for Visual Studio.

Smart Duplicate Line

This is a feature you’ll definitely want to play with. Smart Duplicate Line duplicates the active line, and inserts Text Fields into the duplication to make modification easier. The feature learns your preferences as you use it, so it gets smarter (and saves you more work) over time.

To use Smart Duplicate Line, place the caret on any line and press Shift+Enter.

Here are a few examples of Smart Duplicate Line:

SmartDuplicateLine


Decompose Parameter

This is a refactoring we’ve had in CodeRush Classic, but we’ve just now ported it to CodeRush for Roslyn. This is a very powerful refactoring that allows you to easily change the types of the parameters passed into a method, which can make the method is more widely accessible, promoting reuse.

For example, you might have a method that accepts a large high-level class called “Person”, but inside that method you only access the Age property of that person. Decompose Parameter can simplify that method so it only accepts a numeric Age parameter, and update all calling locations.

Here’s another example. I have a method called GetDistance that accepts two System.Windows.Points, but that parameter type ties the method down to a particular platform. To make this code more flexible and encourage reuse, we can apply Decompose Parameter to both of those Points, turning those parameters into doubles, so this method can be called from any app running on any platform:

DecomposeParameter


XAML Features

  • XAML Code Formatting
  • Import All Types (declares all necessary namespace references needed by the XAML file)

Refactorings, Code Providers, and Code Formatters

  • Break Apart or Line Up both Parameters and Arguments – either collapses a list of method parameters or passed-in arguments into a single line, or breaks them apart into separate lines (one for each parameter or argument).
  • Remove Type Qualifier – removes the explicit namespace definition from symbol usage and adds the corresponding namespace reference to the file's using/imports list. You can use it on a single identifier, on all identifiers in the current file, or as a code cleanup rule.
  • Decompose Parameter (discussed above and shown below)

    DecomposeParameter
  • Extract String to Resource – Adds a string literal to an existing RESX file (creating the new RESX if necessary), and replaces the string with the resource link. You can also optionally extract all string literals within a method or accessor.
  • Declare Parameter– Adds the selected identifier to the method signature and updates all usages.

Unit Testing

Code Coverage now supports .NET Core test cases.

Give It a Try

As always, thanks for your support.

You can grab a shiny new install of CodeRush for Roslyn from the Visual Studio Gallery. CodeRush for Roslyn starts at US$49 for the community support edition. A CodeRush license entitles you to a never-expiring product with a full year’s worth of updates. Updates happen approximately every 45 days.

If you already have CodeRush for Roslyn installed you can check the CodeRush About box for version – make sure it’s at least 16.1.8. If it’s lower, use Visual Studio’s Tools | Extensions and Updates dialog to get the latest updates.

You can see our full What’s New release historyhere.

Simulating per-series ChartJS data binding with a seriesTemplate

$
0
0

At this time, our DevExtreme Charts don't support per-series data binding. I believe this would be a useful feature to have because it simplifies certain solutions considerably, and I hear our team is considering adding the feature in the future. Meanwhile, I was researching approaches to simulate the effects of per-series binding, and here is a workaround you can apply if you need this right now.

First, why does this requirement come up at all? I think the reason is mostly in the data structure you work with. When using data from structured storage, like a relational database system, your data would naturally be arranged along the lines of type separations in that storage.  As it happens, such normalized structures are also efficient for transfer, because they avoid redundancy. 

Here is such a data structure:

const data = [
    { place: "Los Angeles, CA, USA", values: [
        { month: "Jan", degreesC: 13.7 },
        { month: "Feb", degreesC: 14.2 },
        { month: "Mar", degreesC: 14.4 },
        { month: "Apr", degreesC: 15.6 },
        { month: "May", degreesC: 17.0 },
        { month: "Jun", degreesC: 18.7 },
        { month: "Jul", degreesC: 20.6 },
        { month: "Aug", degreesC: 21.3 },
        { month: "Sep", degreesC: 21.0 },
        { month: "Oct", degreesC: 19.3 },
        { month: "Nov", degreesC: 16.4 },
        { month: "Dec", degreesC: 13.8 }] },
    // .... more places and associated lists here
];


With this data, you might want to create one chart series for each of the "places" on the top level, and then each series would be fed by the "values" array associated with the "place". If series-level binding were an option, you could write this:

$("#chart").dxChart({
  series: data.map(p => ({
    name: p.place,
    type: "line",
    data: p.values,
    argumentField: "month",
    valueField: "degreesC"
  }))
});

For clarity, please note that this does not work! Unfortunately, data cannot be bound to the series, it has to be bound to the chart on the top level. 

In case you are unfamiliar with functional programming helpers like "map", you need to know that the helper "map" iterates over the list "data" and executes the function it is given for each element in that array. That function is shown here as a lambda expression, and it generates a series configuration object for each of the "place" elements in the data list, using the "place" name as the series name and assigning "place.values" to the hypothetical "data" property of the configuration object.

Now that we've seen what the problem is, and how great the future could be if we had per-series binding, here's the workaround I promised. The basic idea is that we can use the "seriesTemplate" option of the chart configuration to make the chart generate series automatically on the basis of the data. This is a kind of meta-data-binding feature - instead of pre-creating series at design time and filling those with data at runtime, we set up a series template and use the chart-bound data to determine which series are created in the first place.


Here is another example that does not quite work yet. It shows how the chart can be configured to accept the "seriesTemplate" option:

$("#chart").dxChart({
  dataSource: data,
  commonSeriesSettings: {
    argumentField: "month",
    valueField: "degreesC",
    type: "line"
  },
  seriesTemplate: {
    nameField: "place"
  }
});


The "seriesTemplate" feature is clever: it watches the data field given in "nameField" and creates a new series automatically for each distinct value in that  field. The series is then configured by the parameters given in the "commonSeriesSettings" option, setting up the series field bindings correctly.


The reason this setup doesn't work right now is that the chart expects all the fields mentioned in its configuration to be exist on the same "level" of the bound datasource. However, in the sample data only the "place" field exists on the top level, the other fields are nested in associated arrays. The remaining job is therefor to transform the data to a structure like this:

[
    { place: "Los Angeles, CA, USA", month: "Jan", degreesC: 13.7 },
    ...
]


To execute the transformation, I wrote this function:

function transformData(data) {
  return data.map(p =>
    p.values.map(v => ({
      place: p.place, month: v.month, degreesC: v.degreesC
    }))).reduce((r, v) => r.concat(v));
}


The "map" helper is used again here, starting with the "data" list. For each element in that list, the lambda expression with the parameter "p" is executed ("p" is short for "place"). For each "place", another "map" is called on its "values" array, so eventually the inner lambda expression with the parameter "v" is executed for each of the value items in the nested arrays. This lambda expression returns a new object with the desired structure, combining the top-level and nested values. Finally, the "reduce" call is used to combine the individual arrays that have been generated per "place" into one - if you use a library like underscore or lodash, you can use a helper called "flatten" instead to achieve the same result.

Now I only need to change the "dataSource" assignment of the chart to use this helper:

dataSource: transformData(data),
...


I have created a sample to demonstrate the approach described above:


Binding an Array of Arrays with ChartJS

$
0
0

When I write applications these days, they usually use structured data (compare yesterday's post). This happens because it is very natural - my data is mostly retrieved from some kind of data storage, and whether that's a relational database that runs a query, or a document-based non-relational system (that's politically correct for NoSql), there is usually some structure involved. However, I have seen questions about using less formally structured data, namely arrays and arrays of arrays. The one advantage of this data structure that I can come up with is that it is very compact - certainly not easier to read for a human, but potentially faster to transfer if the data volume is large. Interestingly, some of our - ahem - competitors seem to focus on such data structures to the extent of excluding almost everything else. If you have existing chart setups that use array data, this post might also be interesting to you.


As an example, here is an "array of arrays" data structure:

const data = [[114, 8], [84, 17], [54, 31], [24, 17], [7, 2]];


The problem you face when trying to bind this data to a ChartJS chart is that our binding system uses field names to determine which data elements are used for arguments and values (and potentially other series options). To bind the above data, you need to transform it into a shape that supplies field names. Fortunately this is not really hard to do, and I have written a flexible utility function for the purpose:

function transformArrayOfArrays(source, ...names) {
  const defaultName = i => "field" + i;
  return source.map(a => {
     return a.reduce((r, v, i) => {
       r[i < names.length ? names[i] : defaultName(i)] = v;
       return r;
     }, {});
  });
}

The function accepts a source array as input, as well as - optionally - a list of field names. In the absence of field names, or if the nested arrays contain more values than there are specified names, the "defaultName" function is used to generate field names "field1", "field2" and so on. The function now generates its result by iterating over the top-level array elements. For each such element, the "reduce" function is used to create a new object and add the values from the nested array to this object, using the supplied or generated field names.

Note: I had a question about the "new" ECMAScript 6 syntax I'm using in my sample code. I recommend you look into this if you write code in JavaScript! If you have trouble interpreting a piece of code I'm showing, I recommend checking out the CodePen samples I'm posting. If you follow the link to "edit on CodePen" and then click the "down-arrow" button in the upper right corner of the "JS (Babel)" panel, you have the option to see the compiled (or rather transpiled) JavaScript code. This can be very helpful when you get started with ES6.

Using my sample data, I can now call the function like this:

transformArrayOfArrays(data, "days", "percent")

This sample call would transform my data to this structure:

[{ days: 114, percent: 8 },
 { days: 84, percent: 17 },
 { days: 54, percent: 31 },
 { days: 24, percent: 17 },
 { days: 7, percent: 2 }]

Of course this data can now be bound to a chart easily, using the same field names I supplied to the transformation function call:

  $("#chart").dxChart({
    dataSource: transformArrayOfArrays(data, "days", "percent"),
    series: [{
      argumentField: "days",
      valueField: "percent",
      type: "spline"
    }],
    .....


I have created a sample that shows the use of the transformation helper in conjunction with a chart setup:


US Election Results - WinForms Data Visualization

$
0
0
With the US Presidential Election right around the corner, we thought it appropriate to create a simple tracker app with our WinForms controls. As you can see, the two primary controls used were our WinForms Map Control and our WinForms Grid Control. (download demo source code)

WinForms Data Visualization - US Presidential Election Results

Here's a quick walk-through as to what you'll need to do to create a similar solution.

Step 1 - Obtain Map Data

Our first step was to obtain State and county map data from the U.S. Census Bureau (maps - https://www.census.gov/geo/maps-data/data/cbf/cbf_counties.html, codes https://www.census.gov/geo/reference/codes/cou.html, etc).

We then used QGIS to update our maps for improved visualization (move/resize Alaska and Hawaii)

Step 2 - Collect Election Data

Our next step was to collect election results from the Federal Election Commission and detailed county level voting data from The Guardian.

Step 3 - Normalize Election Data

At this point, we needed to normalize data so that it could be used within our sample application and to ensure that future election results can be integrated without direct modification of our app.  And since we want to create a web version of the same demo, we chose to store election results in JSON format.

Step 4 - Create the App

As I mentioned earlier, to visualize data and create an interactive user experience, we used both our WinForms Map and WinForms Grid Control.


User Interface Elements

Data Grid

To display vote totals at either the National level (when the map is zoomed out - displaying all States) or at the State level (when a State is selected within the map), we use our Grid Control with its Banded View enabled. Those familiar with the Grid already know that it supports use of Progress Bars within its cells...and in our case, we've used progress bars to visualize the vote totals.


Map

We used a U.S. shapefile and colored each State based upon election results - blue if the Electoral College votes were allocated to the Democratic Party and red if the votes were allocated to the Republican party. You'll note that we use colors to differentiate the margin of victory in each State. The darker a color, the larger the margin of victory for a given candidate in that State.

For the tooltip, we're using our “SuperTip” and ToolTipController.

WinForms Data Visualization - US Presidential Election Results


When you click an individual State, the app drills into the available data and lists voting by individual counties within that State (and the Grid content is updated to display vote totals for each county by party).

WinForms Data Visualization - US Presidential Election Results

Custom UI Elements

The only custom UI element used is the Electoral Vote bar at the top of the app. This particular UI element is a standard UserControl with two LabelControls and simple custom draw to paint results. It's used to display both Electoral Vote count and the total number of votes for each candidate.


And finally - to help you predict the 2016 election (as if anyone can actually do that), we added a simulation mode option. Give it a try and see if you can guess who'll be our next President.

Candidate photos courtesy of: Pete Souza, The Obama-Biden Transition Project and Gage Skidmore

Watch the webinar on how to get started with our MVVM Framework for WinForms

$
0
0

Recently, I did a webinar “Rock Your WinForms Apps with DevExpress MVVM".

image

In the webinar, I showed you what MVVM is all about and how to apply this design pattern on your WinForms applications by using our framework.

You can re-watch the recording on YouTube, were you will see some of the powerful designtime and runtime features. The project being built in the webinar is available on GitHub. If you want to perform unit tests on your ViewModel like I mentioned, check out the WPF counterpart on my GitHub account. It has a test project in the solution to give you an idea on how to test your code.

If you have any questions, leave a reaction, email or tweet me.

DevExpress Meetup in the Netherlands

$
0
0

Over the coming weeks, DevExpress is organizing a few informal meetups with our clients. They will give you an opportunity to talk with me directly, let me know what you’re doing with our controls and tools, and give me feedback on features and areas that we could improve.

John Martin, our Developer Advocate, and I will be hosting these events and the only thing they will cost you is a bit of time. We shall be taking care of providing the beer and snacks!

We are organizing 2 meetups in The Netherlands and we hope to see many of you.

So far we have the following meetups planned:

Date

TimeLocation
November 15th17:00h – 21:00hHaarlem
December 6th18:00h – 20:00hRotterdam

To make sure we have enough capacity we would like you to register for free through Eventbrite.

If any of these locations are too far from you, let me know and we might insert some additional meetups.

DevIntersection Europe is around the corner

$
0
0
DEVEurope_DWibier_336x280

From November 14th till November 16th, DEvIntersection Europe is being held in Haarlem, The Netherlands. Guess what…? DevExpress is sponsoring this great conference.

If you check the awesome speaker line-up, you’ll see that I will do 2 sessions as well, so you’re invited to join me. To make it even more attractive to attend, I have a special discount code you can use when purchasing the tickets and you’ll save 10% on your ticket!

John and I will be there with our booth giving demos and handing out T-Shirts and other goodies. We will be raffling off some cool prizes like a platform subscription of choice every day.

If you’re there, make sure to come by our booth to say hello and get your raffle ticket!

Viewing all 2417 articles
Browse latest View live