The list of different report types supported by the DevExpress Reporting tools continues to grow. In v18.2 we introduced vertical bands, and with v19.1 there will be support for hierarchical data. This functionality enables you to print tree-like data structures – here’s how it works.
New DetailBand Class Members
On the DetailBand, you can now find the property HierarchyPrintOptions with these nested items:
KeyFieldNameandParentFieldName– These properties define the data bound fields that represent the parent-child relationship (Parent ID and Child ID) in a data source.ChildListFieldName– If your parent type has anIList<T>sub-collection for related child objects, use this property to specify its name.Indent– This property allows you to define the child level node offset in report units.KeepTogetherWithFirstChild– Enable this property to make sure that a parent node is not separated from its first child by a page break.
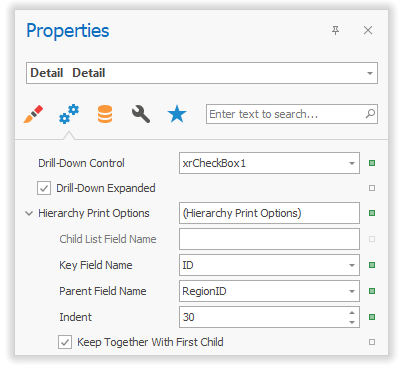
With these properties configured, the print preview shows how the DetailBand recursively steps through the entire data tree, shifting its own position to the right using the HierarchyPrintOptions.Indent property value:
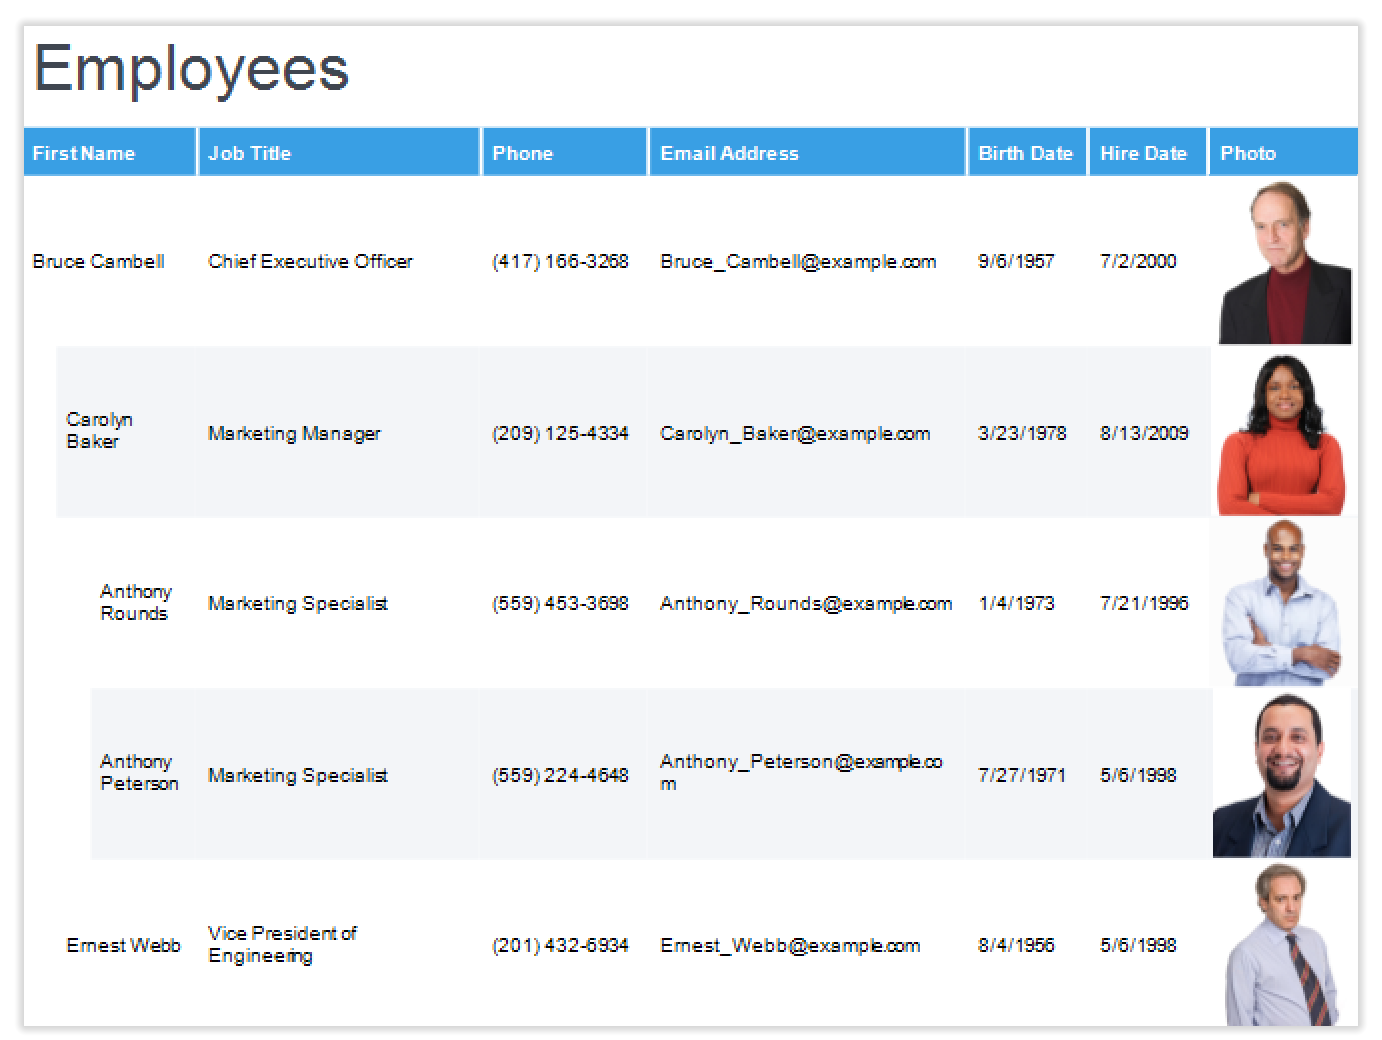
In the past, the TreeListControl was sometimes used to include hierarchical data in reports. The new functionality on the band level has several advantages in comparison:
- You can use the
PageHeaderBandto create a tree header that repeats on each page - You can print two or more trees side by side using sub-reports
- You can design a
DetailBandor any sub-bands and print them conditionally. The new propertyDetailBand.CurrentRowHierarchyLevelprovides access to the current node level in expression bindings:

Anchoring
The value of the property XRControl.AnchorHorizontal has an important effect on hierarchical reports. For example, here’s a report that doesn’t use horizontal anchoring for its table cells:
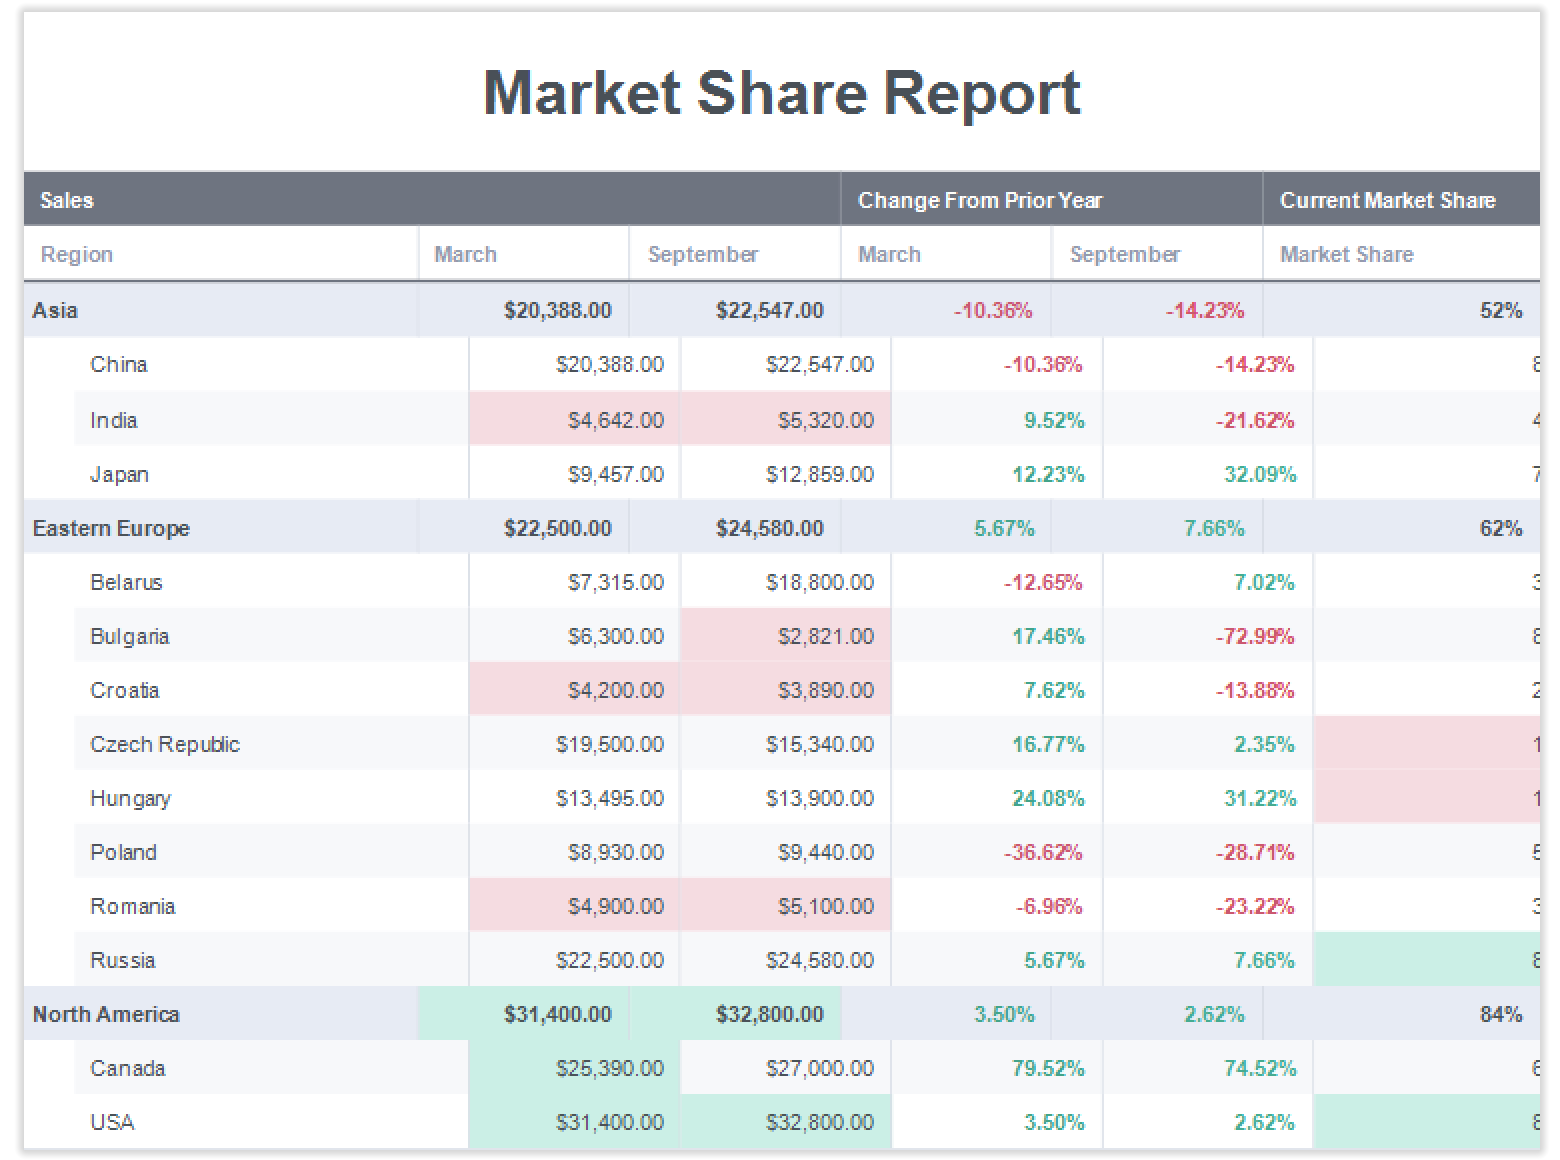
You can see that the output is incorrect: columns don’t line up properly and the content of the right-most column is pushed off the page. This is what happens when XRControl.AnchorHorizontal is set to None or to Left on the table cells. The controls are shifted to the right by the value configured in HierarchyPrintOptions.Indent.
By setting AnchorHorizontal to Right, you can preserve the left and right borders of a control. If all table cells are configured this way, the report looks like this:
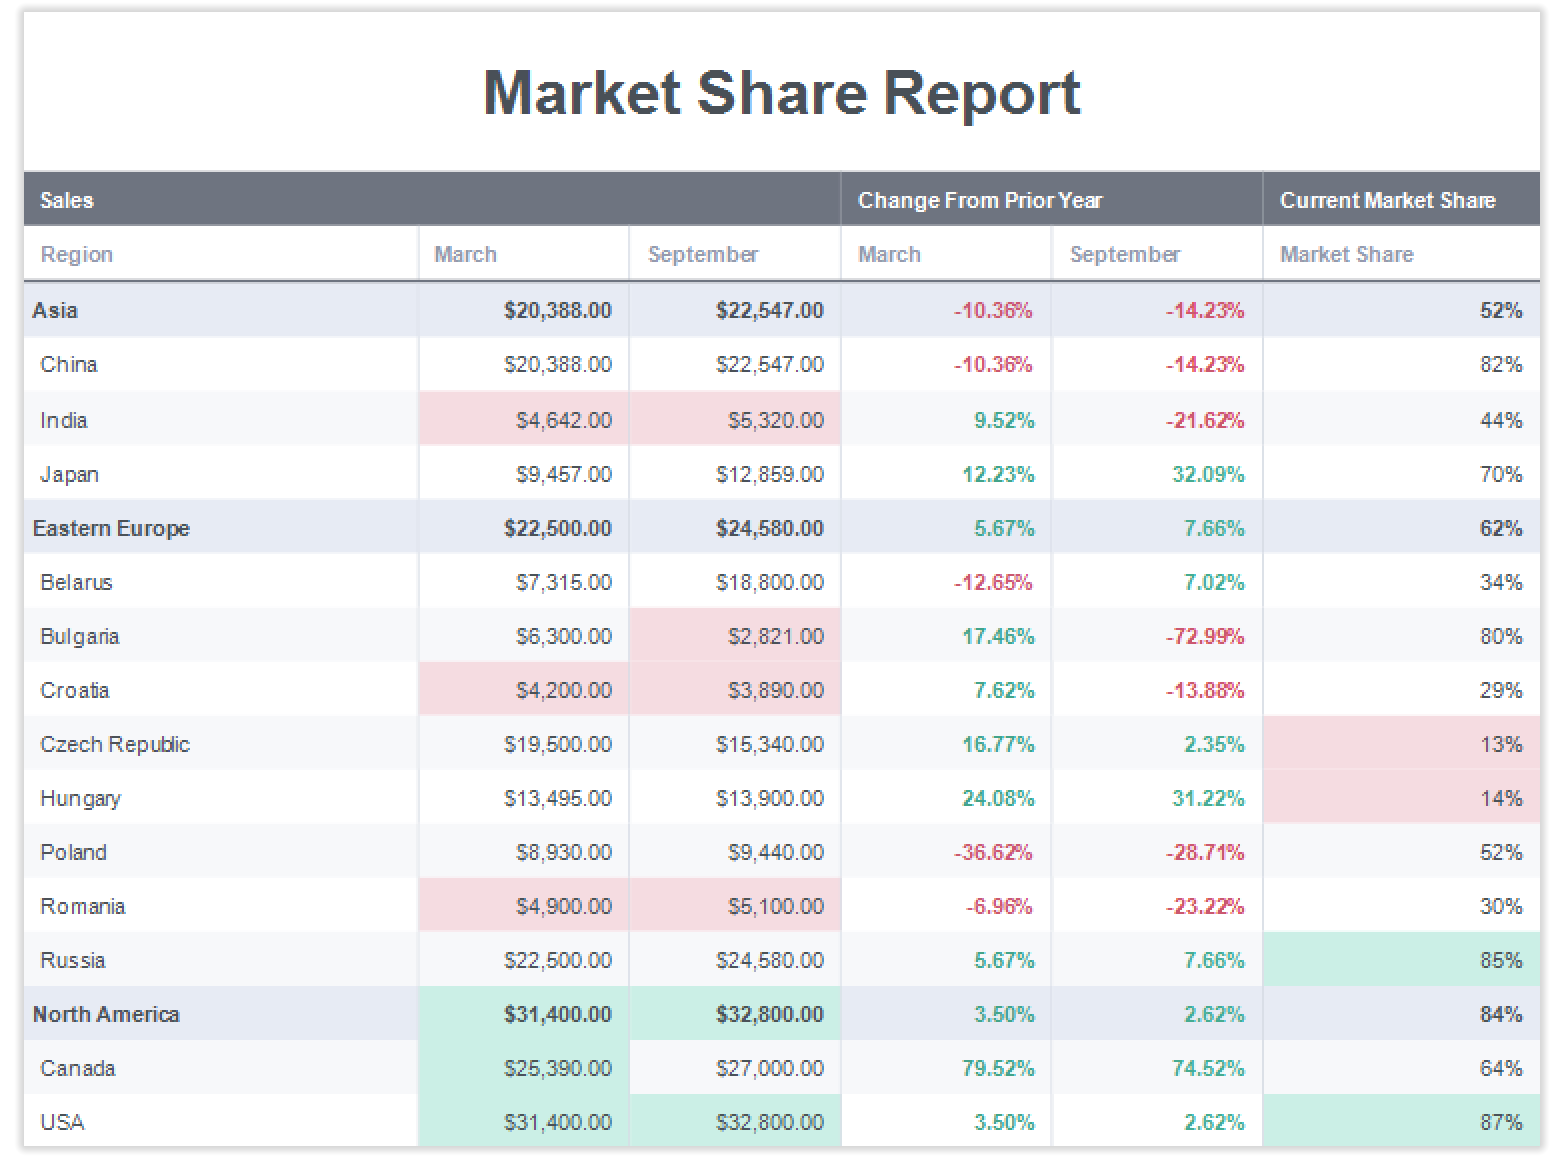
Finally, the property value Both can be used to combine behaviors. The left border of the control is shifted by the Indent value, but the right border stays in place. For the sample report, this is useful for the first column, since it introduces some extra indentation to distinguish clearly between parent and child rows.
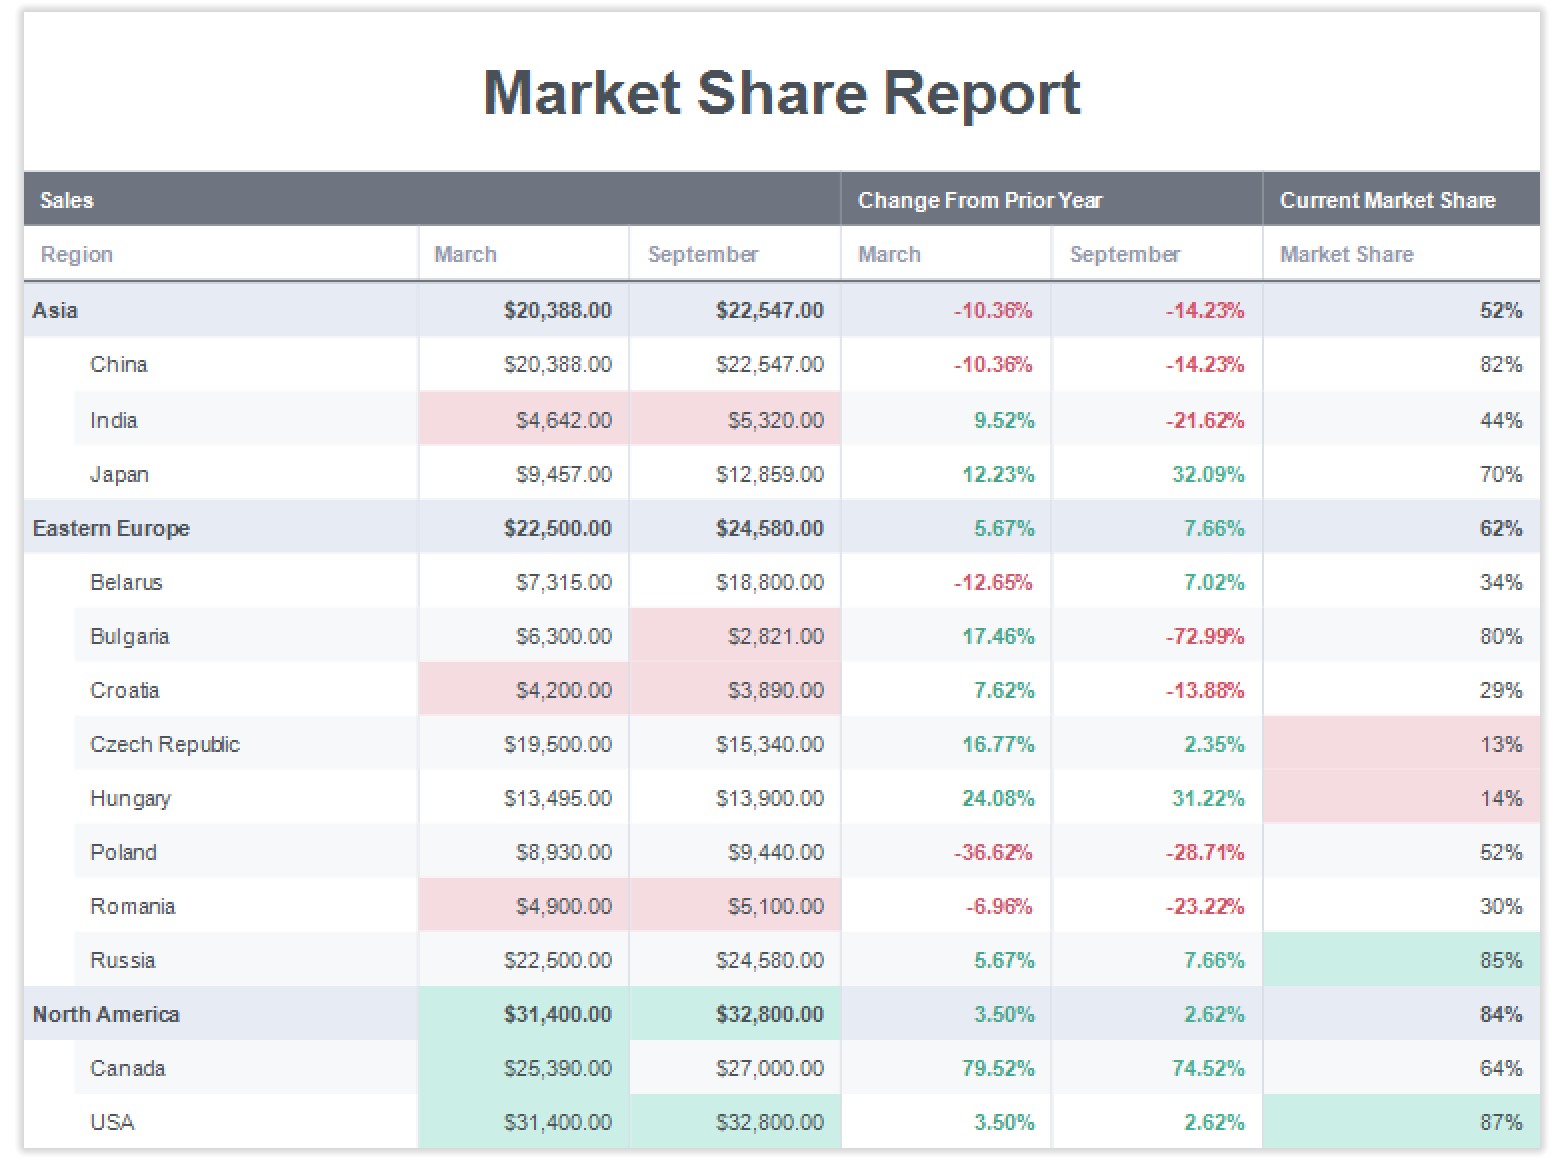
Drill-Down Support Is Available
Once you define the DetailBand.HierarchyPrintOptions, a property editor becomes available for the property DetailBand.DrillDownControl. You can select a report control that manages the drill-down functionality. This control must be located in the same DetailBand. In our demo we use an XRCheckBox with custom glyphs for the purpose. The XRCheckBox.CheckState property value is bound to DetailBand.DrillDownExpanded using an expression binding:
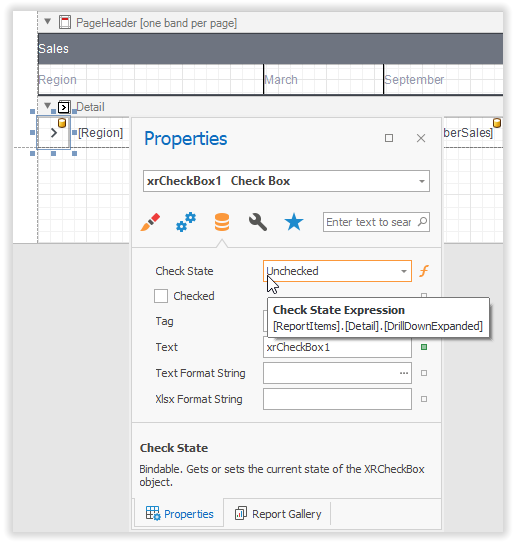
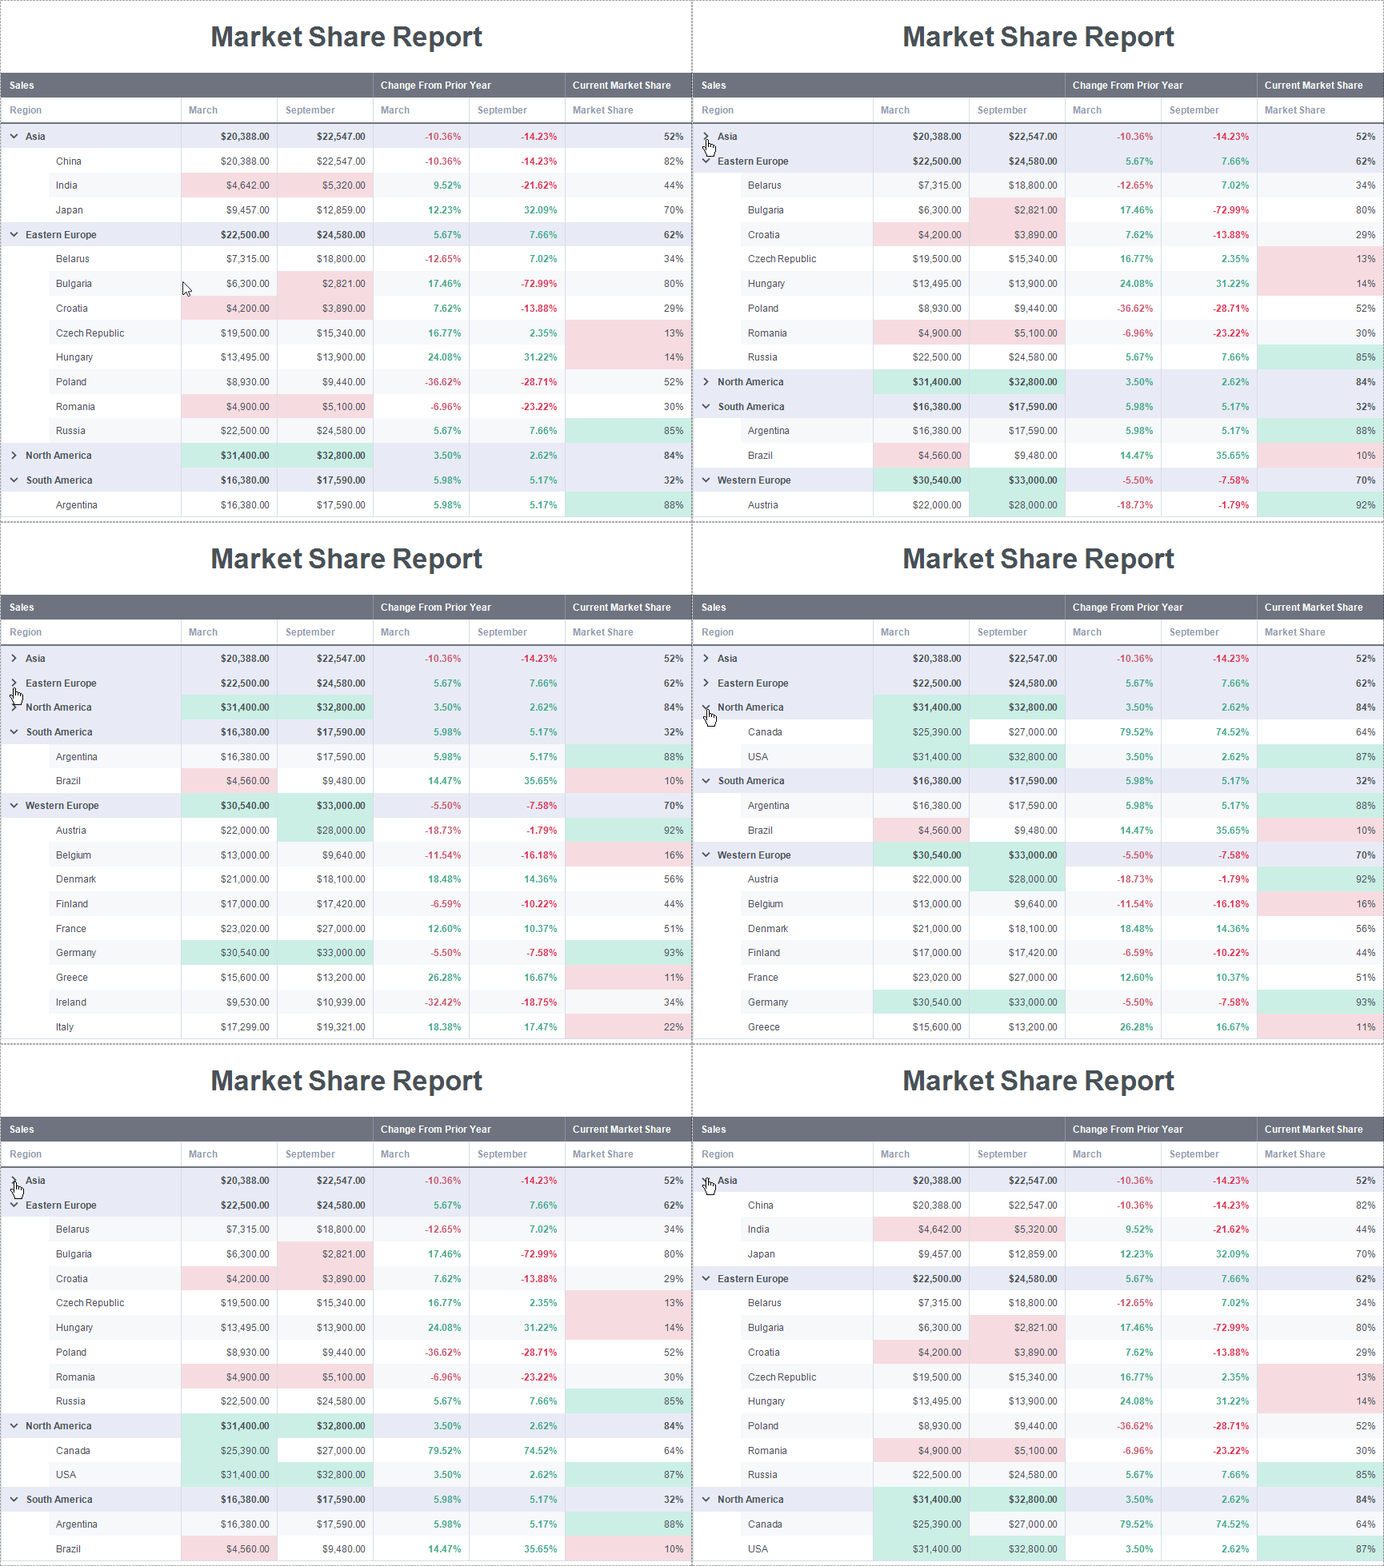
In the Print Preview, the control can be used as an interactive expander for the hierarchical data:
What Do You Think?
As always, we are very interested in your feedback! Please feel free to comment below or to open a Support Center ticket for further discussion.