The details in this post apply to the ChartControl in WPF and Windows Forms, the WebChartControl in ASP.NET WebForms, and the control created by the DevExpress.Chart() function when using ASP.NET MVC Extensions.
Additional flexibility for MeasureUnit
When visualizing DateTime values using a chart, it is possible to customize the detail level by setting the DateTimeScaleOptions.MeasureUnit property to a predefined unit (e.g. day, hour, minute, second, etc).
For our upcoming v18.1 release, we extended this functionality by introducing the property MeasureUnitMultiplier, which accepts an integer value. For instance, by setting the MeasureUnit to Minute and the MeasureUnitMultiplier to 15, you configure a measure unit of 15 minutes.
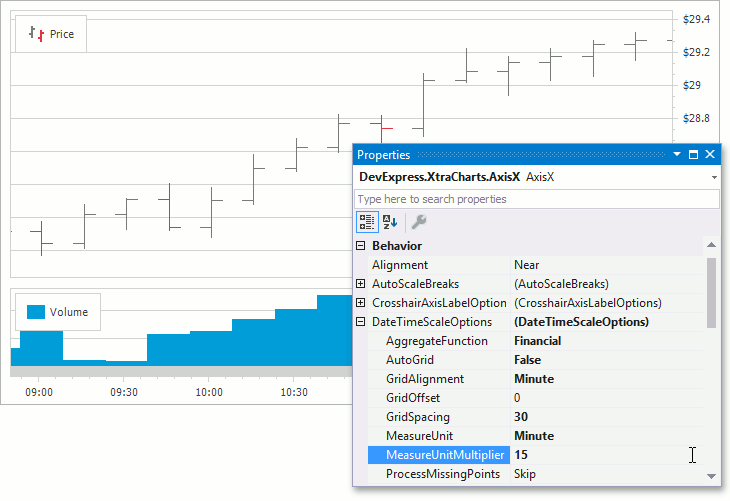
It is important to mention that this feature is not currently compatible with work time and work day options. When a custom measure unit is specified, i.e. with a MeasureUnitMultiplier other than 1, these features are disabled.
Custom aggregation functions
In addition to custom measure units, we also improved the Data Aggregation mechanism by introducing a custom aggregation function API.
To enable this feature, set the AggregateFunction property for the axis scale to Custom and specify a callback that calculates aggregated values.

Below is the sample custom aggregation function that transforms values into OHLC format for the image above.
XYDiagram diagram = chartControl.Diagram as XYDiagram;
diagram.AxisX.DateTimeScaleOptions.AggregateFunction = AggregateFunction.Custom;
diagram.AxisX.DateTimeScaleOptions.CustomAggregateFunction = new OhlcAggregateFunction();

class OhlcAggregateFunction : CustomAggregateFunction {
  public override double[] Calculate(GroupInfo groupInfo) {
    double open = groupInfo.Values1.First();
    double close = groupInfo.Values1.Last();
    double high = Double.MinValue;
    double low = Double.MaxValue;

    foreach (double value in groupInfo.Values1) {
      if (high < value) high = value;
      if (low > value) low = value;
    }

    return new double[] { high, low, open, close };
  }
}


