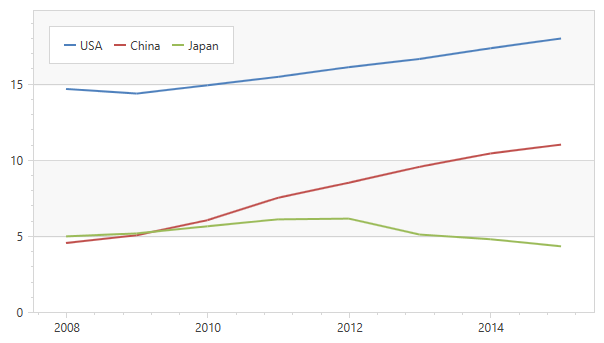
For all of you doing MVVM development with the DevExpress MVVM Framework and also have to deal with the Charts, I'm happy to announce that you can now use binding expressions in your XAML to configure and populate the ChartControl.
With v17.1, you can now bind the series, secondary axes as well as axis labels to properties of the ViewModel.
Image may be NSFW.
Clik here to view.
To get the chart above in one of your views, you could use the following property in your ViewModel to populate the series as well as the series names:
    public class GdpSeries
    {
        public string CountryName { get; set; }
        public IEnumerable Values { get; set; }
    }

    public class Gdp
    {
        public int Year { get; set; }
        public double Value { get; set; }
    }

    public class ChartViewModel {
        public IEnumerable GdpSeries { get; private set; }
        public ChartViewModel() {
            GdpSeries = new Collection {
                new GdpSeries {
                    CountryName = "USA",
                    Values = new Collection {
                        new Gdp { Year = 2015, Value = 18.037},
                        new Gdp { Year = 2014, Value = 17.393},
                        new Gdp { Year = 2013, Value = 16.692},
                        new Gdp { Year = 2012, Value = 16.155},
                        new Gdp { Year = 2011, Value = 15.518},
                        new Gdp { Year = 2010, Value = 14.964},
                        new Gdp { Year = 2009, Value = 14.419},
                        new Gdp { Year = 2008, Value = 14.719}
                    }
                },
                new GdpSeries {
                    CountryName = "China",
                    Values = new Collection {
                        new Gdp { Year = 2015, Value = 11.065},
                        new Gdp { Year = 2014, Value = 10.482},
                        new Gdp { Year = 2013, Value = 9.607},
                        new Gdp { Year = 2012, Value = 8.561},
                        new Gdp { Year = 2011, Value = 7.573},
                        new Gdp { Year = 2010, Value = 6.101},
                        new Gdp { Year = 2009, Value = 5.11},
                        new Gdp { Year = 2008, Value = 4.598}
                    }
                },
                new GdpSeries {
                    CountryName = "Japan",
                    Values = new Collection {
                        new Gdp { Year = 2015, Value = 4.383},
                        new Gdp { Year = 2014, Value = 4.849},
                        new Gdp { Year = 2013, Value = 5.156},
                        new Gdp { Year = 2012, Value = 6.203},
                        new Gdp { Year = 2011, Value = 6.157},
                        new Gdp { Year = 2010, Value = 5.7},
                        new Gdp { Year = 2009, Value = 5.231},
                        new Gdp { Year = 2008, Value = 5.038}
                    }
                }
            };
        }
    }
In the XAML code you can use the following notation to have the Chart populated:
<dxc:ChartControl><dxc:ChartControl.Legends><dxc:Legend HorizontalPosition="Left"
                            VerticalPosition="Top"
                            Orientation="Horizontal"/></dxc:ChartControl.Legends><dxc:XYDiagram2D SeriesItemsSource="{Binding GdpSeries}"><dxc:XYDiagram2D.SeriesItemTemplate><DataTemplate><dxc:LineSeries2D DisplayName="{Binding CountryName}"
                                          DataSource="{Binding Values}"
                                          ArgumentDataMember="Year"
                                          ValueDataMember="Value"/></DataTemplate></dxc:XYDiagram2D.SeriesItemTemplate></dxc:XYDiagram2D></dxc:ChartControl>
Let me know if you think this is a useful feature.
Also let me know if you're missing certain things in the framework so we can see if we can address them in an upcoming release.
Image may be NSFW.Clik here to view.