With the debut of our WinForms Sparkline control we’ve decided to also add it to our reporting toolbox.
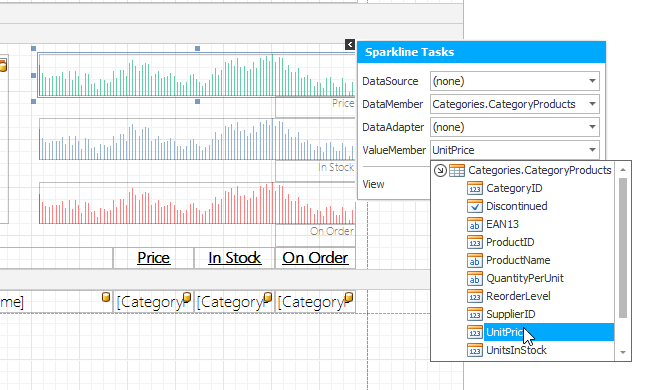
Using Sparklines in reports is fairly straightforward. In this case I created the simple Category/Products report from the Northwind Database and added several Sparkline controls to the group header band of the Product detail section. From there it was a simple case of selecting the appropriate data member (which is already available from the report bindings) and value member. From there one can select the appropriate view and customize the colors as well as specific view properties.
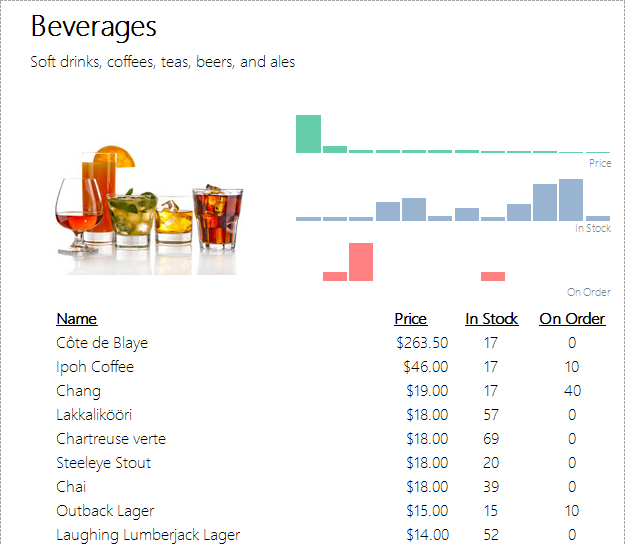
The end result is both elegant and informative! At a glance we cam compare product price, stock, and orders at a glance. For Beverages it becomes readily apparent that we have a stocking problem with one product and a pricing problem with another.
I am excited for the kinds of reports this type of control will enable and am looking forward to what you create!
As always, if there are any comments and/or questions, feel free to get a hold of me!
Seth Juarez
Email: sethj@devexpress.com
Twitter: @SethJuarez

