Why is proper memory management crucial when modern devices ship with gigabytes of RAM? In simple terms, memory leaks can significantly degrade performance, drain device batteries, and/or crash an app. In this blog post, I'll outline common .NET MAUI-related memory leaks and show you how to locate/address leaks using .NET Meteor and Heapview. If you've never used .NET Metear or Heapview, feel free to watch the following short YouTube video first:
Common Memory Leaks in .NET MAUI
Before diving into common .NET MAUI memory leaks, let's first review the fundamentals of .NET memory management.
As you know, managed memory is overseen by the garbage collector (GC), which handles both memory allocation and deallocation when objects are no longer in use. Memory allocated to an object can only be reclaimed if no strong references to the object exist from other objects. The GC can detect cyclic references, so even if ObjectA and ObjectB reference one another, they can still be collected and released.
It's important to remember that the garbage collector only manages .NET objects. If an object allocates unmanaged memory, you must call Dispose . You can do so explicitly or by adding the using statement to the variable definition:
//implicit dispose
using var fileStream = new FileStream(filePath, FileMode.Open, FileAccess.Read)

//explicit dispose
var fileStream = new FileStream(filePath, FileMode.Open, FileAccess.Read)
//...
fileStream.Dispose()
The using statement ensures that the compiler automatically calls Dispose when a variable goes out of scope.
With that brief overview, let's review some common memory leaks in .NET MAUI-powered applications and what you can do to address them. If you'd like to follow along to this blog post, please download the following sample GitHub project:
Download Test ApplicationReference from a long-lived object or static property
One common cause of memory leaks is creating a strong reference from an object that persists for the entire application runtime. For example, if you reference a child page from AppShell, the child page will never be released. The same issue can arise if you create a reference from a static property:
public partial class AppShell : Shell {
    public List<ContentPage> OpenedChildPages = new List<ContentPage>();
    public AppShell() {
        InitializeComponent();
    }
}

public partial class DirectReferenceLeakPage : ContentPage {
    public DirectReferenceLeakPage () {
        InitializeComponent();
       ((AppShell)App.Current.MainPage).OpenedChildPages.Add(this);
    }
} 
To address the leak, remove the strong reference in the OnDisappearing event handler. If the same page instance can be opened multiple times, create the reference in the OnAppearing event handler instead of the page constructor:
private void OnDisappearing(object sender, EventArgs e) {
    ((AppShell)App.Current.MainPage).OpenedChildPages.Remove(this);
}

private void OnAppearing(object sender, EventArgs e) {
    ((AppShell)App.Current.MainPage).OpenedChildPages.Add(this);
}
Event Handler or Function Delegate
When you subscribe to an event, the event source holds a reference to the subscriber (to be able to call its handler). A memory leak only occurs if you subscribe to a long-lived object event. If the event source and the subscriber have the same lifetime, leaks will not occur. For instance, subscribing to the Clicked event of a Button on the same page won't cause a leak (because the .NET garbage collector detects cycles and releases objects that reference each other).

The following code will cause a leak because the long-lived Accelerometer object holds a reference to the Accelerometer_ReadingChanged delegate:
public partial class EventLeakPage : ContentPage
{
    public EventLeakPage() {
        InitializeComponent();
        Accelerometer.ReadingChanged += Accelerometer_ReadingChanged;
    }
    private void Accelerometer_ReadingChanged(object sender, AccelerometerChangedEventArgs e) {
        //...
    }
}
The same issue can occur if you pass a function delegate to a long-lived object. A common example is the Dispatcher.StartTimer method, which accepts a function delegate as its second parameter:
public partial class DelegateLeakPage : ContentPage {
    public DelegateLeakPage() {
        InitializeComponent();
        Dispatcher.StartTimer(TimeSpan.FromSeconds(1), TimerTick);
    }
    bool TimerTick() {
         //...
    }
} private void OnAppearing(object sender, EventArgs e) {
Accelerometer.ReadingChanged += Accelerometer_ReadingChanged;
}
private void OnDisappearing(object sender, EventArgs e) {
Accelerometer.ReadingChanged -= Accelerometer_ReadingChanged;
} Controls with a Memory Leak
If a page includes at least one control that isn't properly released, it will prevent the entire page from being released. This happens because all .NET MAUI controls include a Parent property. All references stored in Parent point back to the page.

A potential fix is to replace the problematic component with a different control or remove it when a user navigates to another page.
Singleton View
mauiAppBuilder.Services.AddTransient<MyPage>();
mauiAppBuilder.Services.AddSingleton<MyPage>(); .jpg)
Memory Profiling with .NET Meteor and Heapview
Since .NET doesn't document memory leaks, how can we identify objects cluttering memory?
One option is to use the .NET Meteor VS Code extension (to capture a memory dump). Once captured, we can visualize the memory dump via Heapview.
Here's how to configure .NET Meteor to capture a memory dump.
Step 1: Install Tools
First, we'll need to install the appropriate tools:
- Visual Studio Code - a lightweight, cross-platform editor that, with the help of a few extensions, provides all the IDE capabilities needed to develop .NET MAUI apps for multiple operating systems.
- .NET Meteor - a VS Code extension for running, debugging, and profiling .NET MAUI projects.
- Heapview - a cross-platform .NET tool for visualizing memory snapshots. To install it, run the following command using the Command Prompt or VS Code Terminal:
dotnet tool install -g dotnet-heapview
Step 2: Prepare App
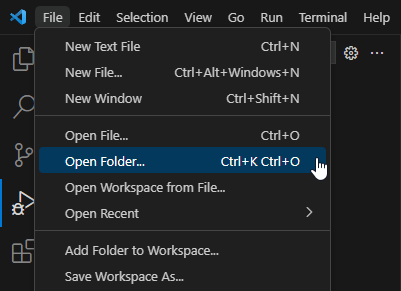
Once we've installed the necessary tools, we must open the target project. Since VS Code does not use Visual Studio *.sln solution files, we'll need to use the Open Folder menu item and select the project folder (for this blog post, I'll use the following sample project: Common .NET MAUI Memory Leaks):
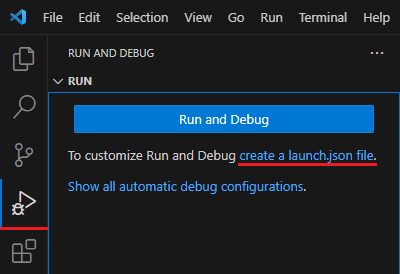
After opening the project folder, we'll navigate to the Run and Debug tab and create a launch.json file.
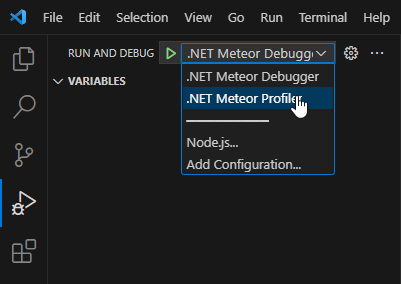
.NET Meteor uses settings from launch.json to run, debug, and profile apps. To profile an application, we'll need to add a configuration entry with the profilerMode attribute set to gcdump
{
    "version": "0.2.0",
    "configurations": [
        {
            "name": ".NET Meteor Debugger",
            "type": "dotnet-meteor.debugger",
            "request": "launch",
            "preLaunchTask": "dotnet-meteor: Build"
        },
        {
            "name": ".NET Meteor Profiler",
            "type": "dotnet-meteor.debugger",
            "request": "launch",
            "profilerMode": "gcdump",
            "preLaunchTask": "dotnet-meteor: Build"
        }
    ]
}
We'll now save the modified launch.json file and select the profiling configuration from the dropdown menu next to the Start button.
Next, we'll select the device used to run the project:

Step 3: Obtain a Profiling Snapshot
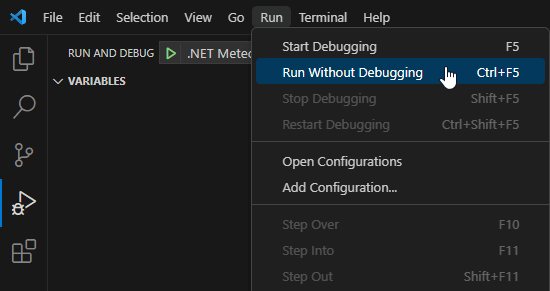
We can now run our sample application and collect profiling data (be certain to select Run Without Debugging).
Before collecting the memory dump, we must invoke the garbage collector's Collect and WaitForPendingFinalizers methods. We'll need to call these methods multiple times, as garbage collection occurs in several cycles. Note: in your .NET MAUI project, you can create a button for profiling purposes and trigger garbage collection via the Button.Click event handler:
GC.Collect();
GC.WaitForPendingFinalizers();
If you're running our GitHub test project, you can click the green button to invoke these methods.
We can now open the VS Code Debug Console window and execute the /dump command to generate a memory dump file (which will be added to the project folder). If following along, you should see a message like this:
Writing gcdump to '...\com.companyname.TypicalMemoryLeaks.gcdump'...
command handled by DotNet.Meteor.Debug.GCDumpLaunchAgent
Finished writing 672119 bytes.
If the device port used by .NET Meteor is busy (and unable to obtain the memory dump), the memory dump won't be collected. To address the issue, you should modify the Profiler Host Port setting. Navigate to VS Code Extensions Tab | Extension Settings | Profiler Host Port, and make the necessary change:

Step 4: Analyze Snapshot
The memory dump should now be in the project folder. To analyze it with Heapview, we'll open a new Terminal window in VS Code (Terminal | New Terminal) and execute the dotnet-heapview command with the memory dump file name as a parameter:
dotnet-heapview com.companyname.TypicalMemoryLeaks.gcdumpThis will open the following in Heapview:

- Types of objects currently held in memory.
- Instances of these objects in memory.
- Number of child items held by the current object.
- Chain of elements that prevent the selected object from being released.
In this example, the page named DirectReferenceLeakPage(1) has three active instances (2) and seventeen references to child objects (3). In the Retainers panel, note that DirectReferenceLeakPage is part of a list of ContentPages in the AppShell object (4). Since AppShell persists throughout the application's lifecycle, it will never be released. To fix the leak, we need to remove DirectReferenceLeakPage from AppShell references.
We'll address this particular memory leak by removing the reference to DirectReferenceLeakPage in the OnDisappearing event handler:
private void OnDisappearing(object sender, EventArgs e)
{
    ((AppShell)App.Current.MainPage).OpenedChildPages.Remove(this);
}
Once the leak is fixed, we can collect the memory dump once again and open it in Helpview. Notice that DirectReferenceLeakPage can no longer be found in the retained objects view:

Summary
Needless to say, identifying the source of a memory leak can be challenging. .NET Meteor and Heapview can help you isolate unreleased objects and trace associated references (crucial for diagnosing both common and atypical memory-related issues).
If you are new to .NET MAUI or want to optimize an existing .NET MAUI project, be sure to review the following blog post: How to Profile .NET MAUI Applications and Isolate Performance-Related Issues