According to Google/SOASTA research, bounce rates increase by 32% when page load takes 1-3 seconds. Though enterprise mobile app users are unlikely to close an application if they encounter unnecessary delays, performance issues may affect perception/overall user experience. Understanding/addressing performance bottlenecks can be challenging (and time consuming) but mastering the process can help enhance app usability/adoption.
In this blog post, I’ll demonstrate a simple technique to profile .NET MAUI applications using .NET Meteor and Speedscope VS Code extensions. You can leverage the techniques outlined herein whether using Windows or macOS. If you'd prefer, you can also watch a step-by-step tutorial video on YouTube:
Step 1: Install Tooling
We'll use the following tools in this tutorial:
Visual Studio Code– a lightweight cross-platform editor. Powered by a few extensions, it offers all the IDE capabilities required to develop .NET MAUI apps, regardless of the OS used.
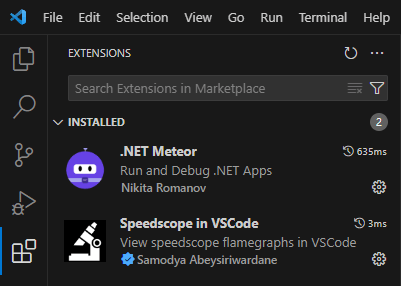
.NET Meteor– a VS Code extension for running, debugging, and profiling .NET MAUI projects.
Speedscope– a VS Code extension to render profiling snapshots as a flame graph.
You can download .NET Meteor and Speedscope from the Visual Studio Marketplace or use the “Extensions” tab in VS Code.
Step 2: Prepare Application
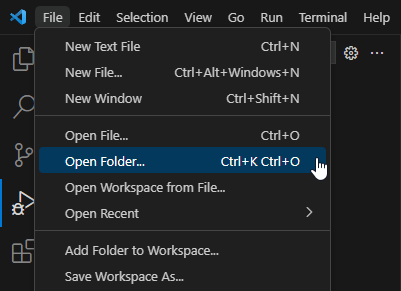
Once necessary tooling is installed, simply open the project you'd like to profile. As you know, VS Code doesn’t use "*.sln" solution files created in Visual Studio. Therefore, to open your project, use the “Open Folder” menu item and select the project folder.
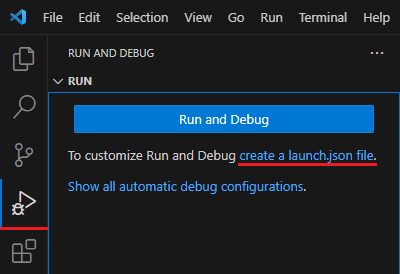
Once open, navigate to the “Rund and Debug” tab and create a “laungh.json” file.
.NET Meteor applies settings for running, debugging, and profiling apps from this file. To profile an application, add a configuration entry with the “profilerMode” attribute set to “trace”.
{
    "version": "0.2.0",
    "configurations": [
        {
            "name": ".NET Meteor Debugger",
            "type": "dotnet-meteor.debugger",
            "request": "launch",
            "preLaunchTask": "dotnet-meteor: Build"
        },
        {
            "name": ".NET Meteor Profiler",
            "type": "dotnet-meteor.debugger",
            "request": "launch",
            "profilerMode": "trace",
            "preLaunchTask": "dotnet-meteor: Build"
        }
    ]
}
You can set “profilerMode” to “gcdump” for memory profiling, but I’ll describe this mode in a separate blog post.
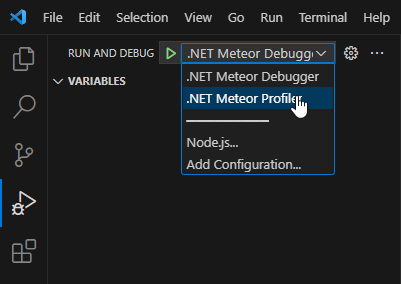
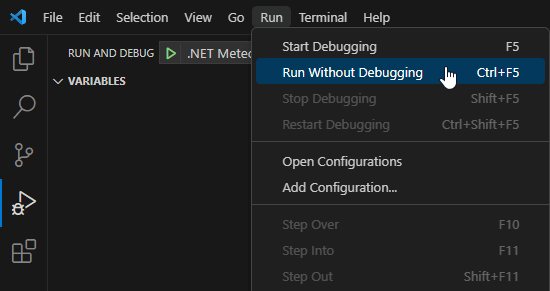
Save the modified "launch.json" file and select the profiling configuration from the dropdown menu located next to the "Start" button.
Step 3: Obtain Profiling Snapshot
We can now run the application to collect profiling data. Note: Be sure to "Run Without Debugging."
Open the view you'd like to inspect and press the "Stop" button. To obtain a valid snapshot, it's important to stop the application using VS Code instead of closing it on the device/emulator.
Step 4: Analyze Snapshot
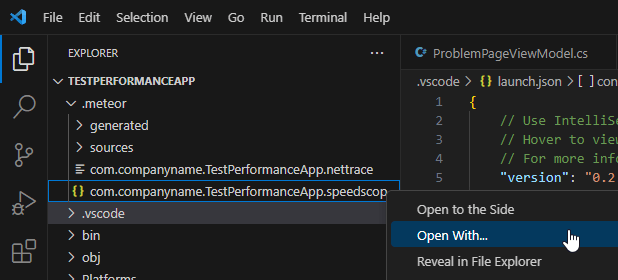
.NET Meteor saves the profiling snapshot to the "*.speedscope.json" file under the ".meteor" directory. Right-click this file and open it with Speedscope.
Once open, you will see a flame graph with all .NET functions called when you interacted with the application. The wider a block, the more execution time for the corresponding function. The flame graph automatically groups methods with a similar call stack (it represents aggregated data, reducing the amount of information you need to analyze). Let’s consider the following simplified flame graph as an example:
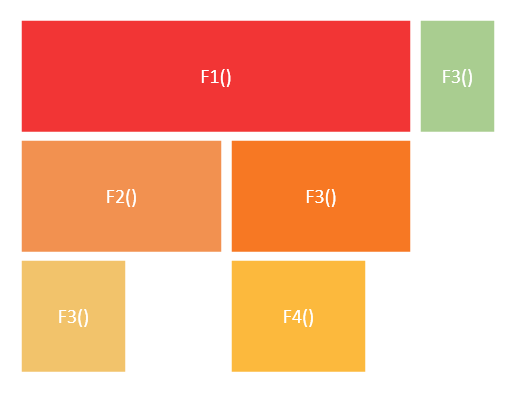
Here, method F1 calls F2, which in turn calls F3. Then, a new F3 starts and calls F4. When F4 is complete, F3 and F1 are completed as well. At this point a new F3 function (green) starts. Because the last F3 function has a different call stack, it’s not merged with F3 functions called earlier.
Let’s take a look at two performance issues I intentionally introduced in my test app.
Sample Issue 1: Heavy View Model Initialization
In the following code snippet, I initialize a collection of items in the view model constructor. When each item is added, the Thread.Sleep method is called causing a delay.
public class ProblemPageViewModel : BindableBase {
    //...
    public ProblemPageViewModel() {
        LongInitializationOperation();
    }
    void LongInitializationOperation() {
        Customers = new ObservableCollection<Customer>();
        for (int i = 1; i < 200; i++) {
            Thread.Sleep(10);
            Customers.Add(new Customer() { ID = i, Name = "Customer" + i });
        }
    }
}
Here is how this code appears in the flame graph.
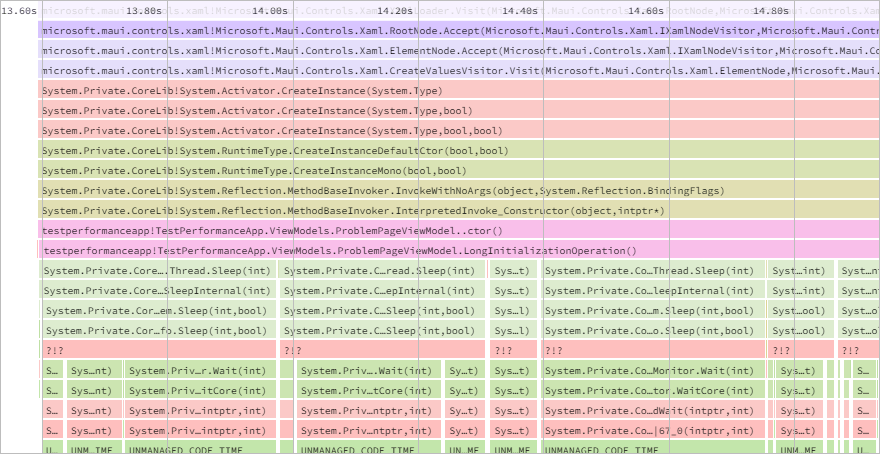
As you can see, LongInitializationOperation is very wide compared to sibling methods which may indicate a potential issue. To focus on a specific method, you can open the “Sandwich” tab, press “Ctrl + F” and find this method. In the “Sandwich” view, you can select a function and see all previous and subsequent methods in a more readable manner.
Here, you can see that the performance issue is caused by the Thread.Sleep method. This is evident because we call it every time a new item is added to the Customers collection. That was a simple example - let’s move on to a more realistic usage scenario.
Sample Issue 2: Unoptimized View Layout
Let’s consider the following view with a vertical stack panel and CollectionView:
<ContentPage xmlns="http://schemas.microsoft.com/dotnet/2021/maui"
             xmlns:x="http://schemas.microsoft.com/winfx/2009/xaml"
             x:Class="TestPerformanceApp.ProblemPage"
             xmlns:viewModels="clr-namespace:TestPerformanceApp.ViewModels"
             Title="ProblemPage">
    <ContentPage.BindingContext>
        <viewModels:ProblemPageViewModel/>
    </ContentPage.BindingContext>
    <VerticalStackLayout>
        <CollectionView ItemsSource="{Binding Customers}"/>
    </VerticalStackLayout>
</ContentPage>
It seems unusual that such a simple layout causes a delay when loading the view, so what’s wrong with this code?
Typically, when a view layout causes performance issues, you will find many “Measure” methods in the flame graph.
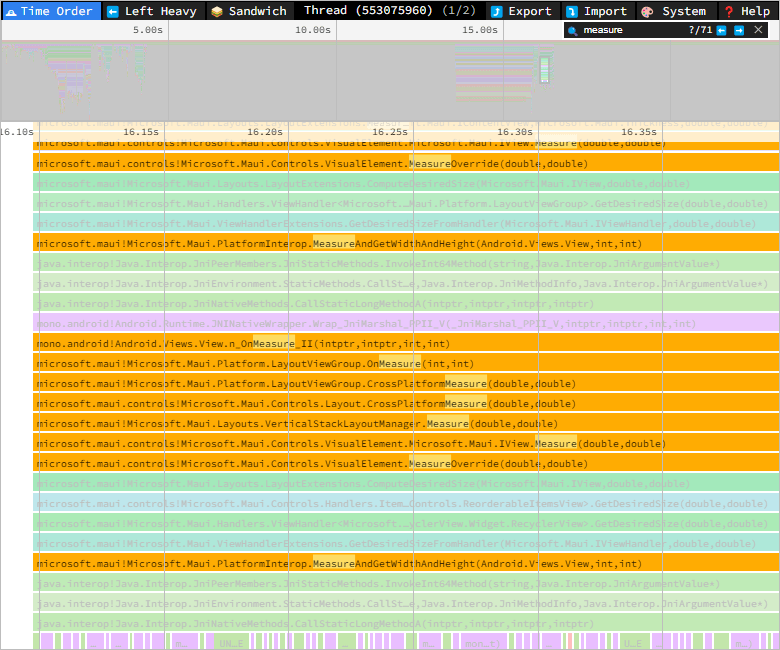
While the profiler won’t reveal the specific cause of the issue, it’s evident that the problem lies in the view layout. One of the simplest ways to pinpoint the cause of the delay is to comment out XAML code sections until you observe an improvement. However, it's essential to examine how different view elements function - both separately and together.
For instance, in the code snippet above, if I comment out the CollectionView, we'd expect a performance improvement, as this is the only relatively complex component in the view. However, CollectionView is a common component, and it would be unusual if it caused such performance issues across all usage scenarios. This suggests that the root cause may be related to its parent panel – VerticalStackLayout. By commenting out the VerticalStackLayout, we see an improvement, indicating that the lag occurs only when VerticalStackLayout is used together with CollectionView.
The reason behind this particular bottleneck lies in the way VerticalStackLayout measures child elements (infinite height is used for all associated children). As a result, the CollectionView “thinks” that it’s very tall, doesn’t activate the virtualization mechanism, and measures all its elements even if they don’t fit the screen. To resolve the issue, we simply need to replace VerticalStackLayout with a Grid using several rows or DXDockLayout.
Conclusion
While performance optimization can be challenging, research shows that performance affects the overall user experience and perceived quality of a given application. Bottleneck identification is the first step in the optimization process and VS Code extensions like .NET Meteor and Speedscope can be invaluable for those interested in performance optimization.
Memory leaks are another common performance-related issue, and .NET Meteor supports memory profiling as well. We will describe this feature in a separate blog post - please stay tuned!
Explore more ways to enhance your next great .NET MAUI mobile app:
- MacOS Guide to Developing for .NET MAUI
- 7 Tips to Boost .NET MAUI Mobile App Performance
- .NET MAUI Mobile — Collection Filtering Best Practices
- .NET MAUI — Incorporate CRUD Operations in Your Mobile App with DevExpress CollectionView


