The most important part of any report is the data which it displays. Here I will spend a bit of time explaining how data views within the report server are managed, who manages them, and some best practices when considering these issues. Also we will look at some general network considerations to take into account when setting up data views in order to elucidate the “why” behind certain limitations when working in a truly distributed environment.
Report Server Topology
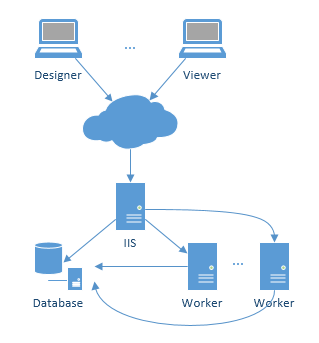 One of our primary concerns was enabling high throughput (getting as many reports out as possible). As such the report server actually consists of three separate things: the administrative site (IIS), the scheduling mechanism (IIS), and the worker processes. The administrative site and the scheduling process live on the same server. The administrative site is an IIS site where all of the management of users, data views, reports, and report scheduling occur. In addition to the IIS site there is a TaskScheduler service that checks if there are report tasks that need to run. Unlike the administrative site, the TaskScheduler is actually a Service process. When a particular report task needs to run, the TaskScheduler informs the Worker process (also a Service). The Worker process then takes the time to render the report and send the emails to the interested parties.
The beauty of this setup is that with our report server we have an option where the Worker process can be installed on multiple machines. This can greatly improve the scenario where hundreds of reports need to be generated at the same time every day. The TaskScheduler will route each task to an available Worker thus maximizing the computing resources devoted to generating reports (I will get more into the specifics of setting this type of structure up in later posts).
Given that the administrative site (and report creation) can be exposed across the web (the administrative site is a web site after all), there are certain limitations that need to be understood. Consider the case where the data that is used in reports is behind a firewall. This database, while accessible to the Report Worker process (since it is behind the firewall as well), will not be accessible to the users accessing the system from outside the firewall. This creates a unique challenge that the Report Server solves with the concept of Data Views.
Data Views
Data Views are collections of data shapes available to reports created in the report server. Often I am told that a business has hundreds of reports. Often these boil down into less than 10 actual data shapes. For example, a consulting firm with hundreds of reports may have only two reportable shapes: Client Reports and Project Reports. In other words they have two basic reportable data shapes. One of my most oft given suggestions when engineering a reporting system is to boil down all reports into their basic shapes. My strategy for doing so involves finding the most important database entities (clients and projects) an hoisting these entities as the root of a data shape. While this is inexact science, creating these basic data shapes allows for easy field addition (on the root or sub entities) without having to modify existing reports bound to the same shape.
Creating Data Views
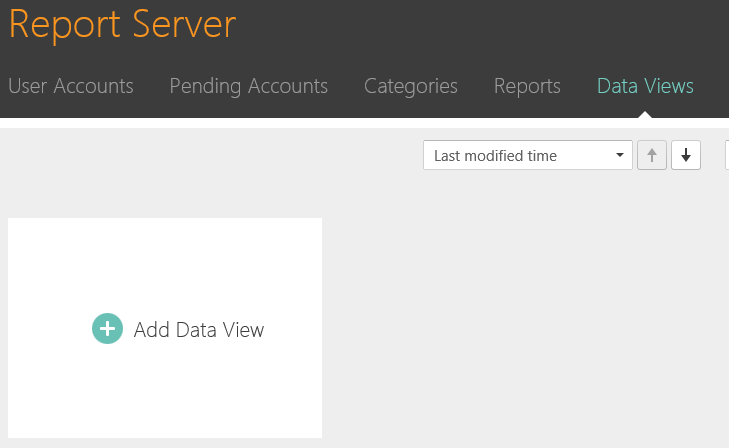
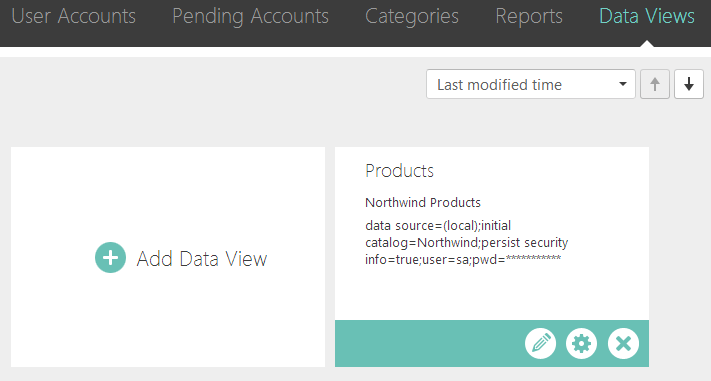
The first step is to navigate to the data views section and select “Add Data View.” Clicking on this option yields the following screen:
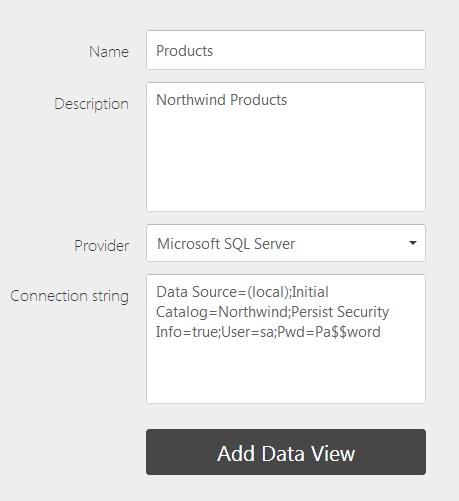
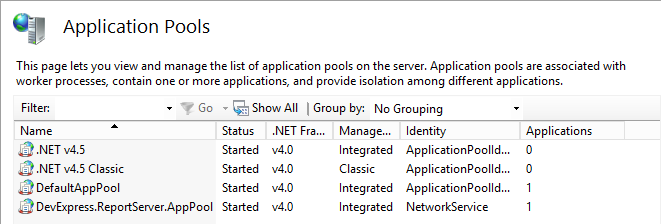
In this example I used the Microsoft SQL Server Provider. The reality is you can use any provide which XPO supports. The key is to remember the general report server layout when creating the connection string. This connection string has a Data Source equal to (local). In the context of the network diagram above (local) refers to the actual IIS server. If any of the worker processes lived on a separate machine, this would cause a problem. Consider also the case where Integrated Security is used to access SQL Server rather than an explicit username and password. In this case which user is accessing SQL Server? If the default installation path was chosen this would be none other than the NETWORK SERVICE user:
Notice that the custom AppPool created in IIS contains the NetworkService Identity. This is also the case for the TaskScheduler and Worker services:
It is essential to understand these key principles when creating Data Views.
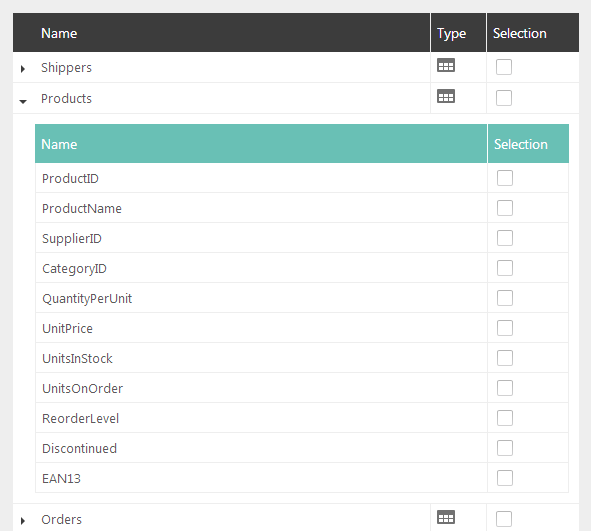
Once the Data View form is filled out and the users presses “Add Data View” the user then can create the data shape to be exposed to the report designers:
One can even control the exact fields within tables that are exposed:
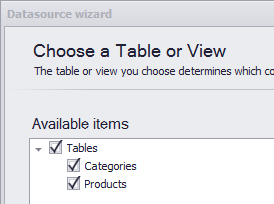
In this case I selected the Products and Categories table. Once the user clicks “Fill Data View” they are taken back to the Data Views page:
Managing Data Views
The task of managing data views falls specifically to data administrators (although System Administrators also have that right). Once a Data View has been created there are two changes that can be made: edit the connection information and edit the shape. Clicking on the pencil icon will take the user to the Data View Form while clicking on the gear will allow the user to change the data shape.
Consuming Data Views
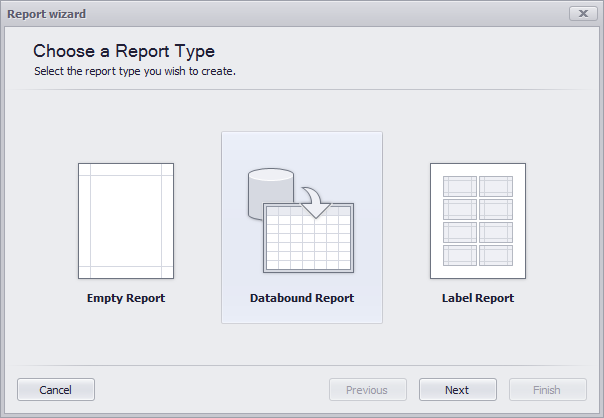
With the data view created, one need only fire up the End User Report Designer to consume the new data shape. There are two options to do this. If you are trying to create a flat table report (i.e. no sub reports) you can select “Databound Report” after adding a new server report:
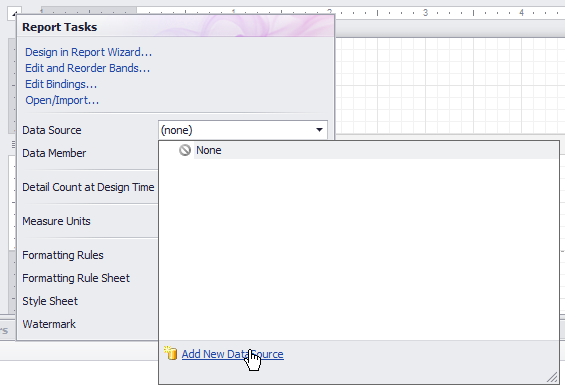
This will lead the user through a standard reporting wizard designed primarily to create flat data bound reports (i.e. no hierarchy in the data shape). This is an absolutely great wizard for the majority of simple reports. If you need to create a more complex report based on a master-detail hierarchy in the data shape, simply select “Empty Report” and fill the data source manually:
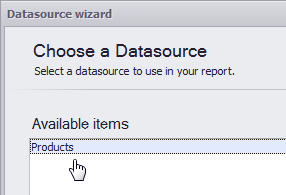
Clicking “Add New DataSource” invokes a new Wizard which lets you select the Data View
as well as the participating entities:
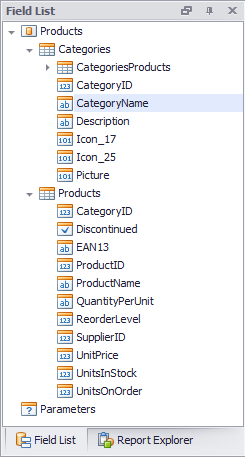
Once the users selects finish they will have access to all of the fields participating in the created data view:
Conclusion
That is it! I hope this little tour through Data Views inside of the Report Server has been helpful. The part that trips most people up is awareness of the actual topology of the network wherein the Report Server resides. Once this is clear, everything else flows much easier.
As always, if there are any comments and/or questions, feel free to get a hold of me!
Seth Juarez
Email: sethj@devexpress.com
Twitter: @SethJuarez
