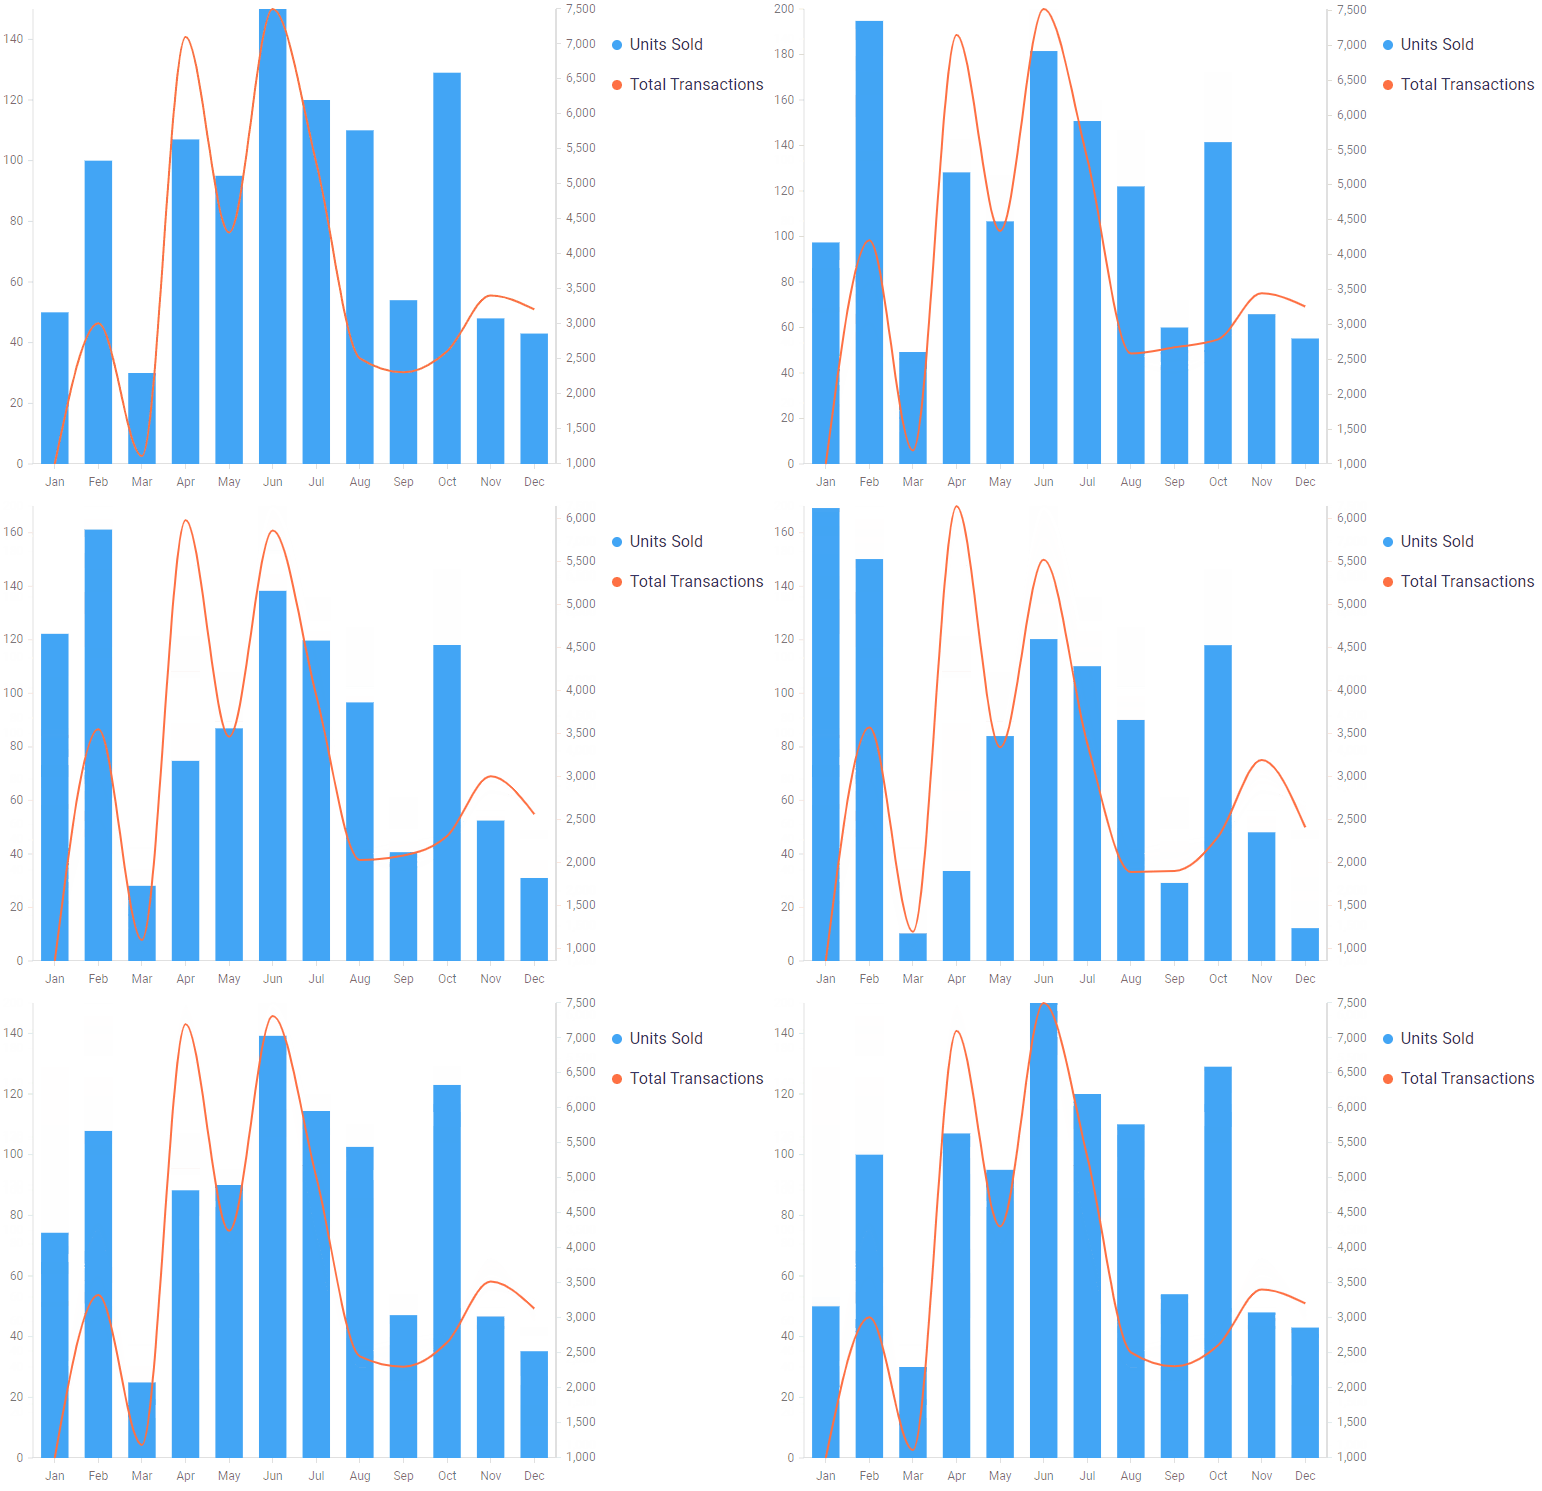
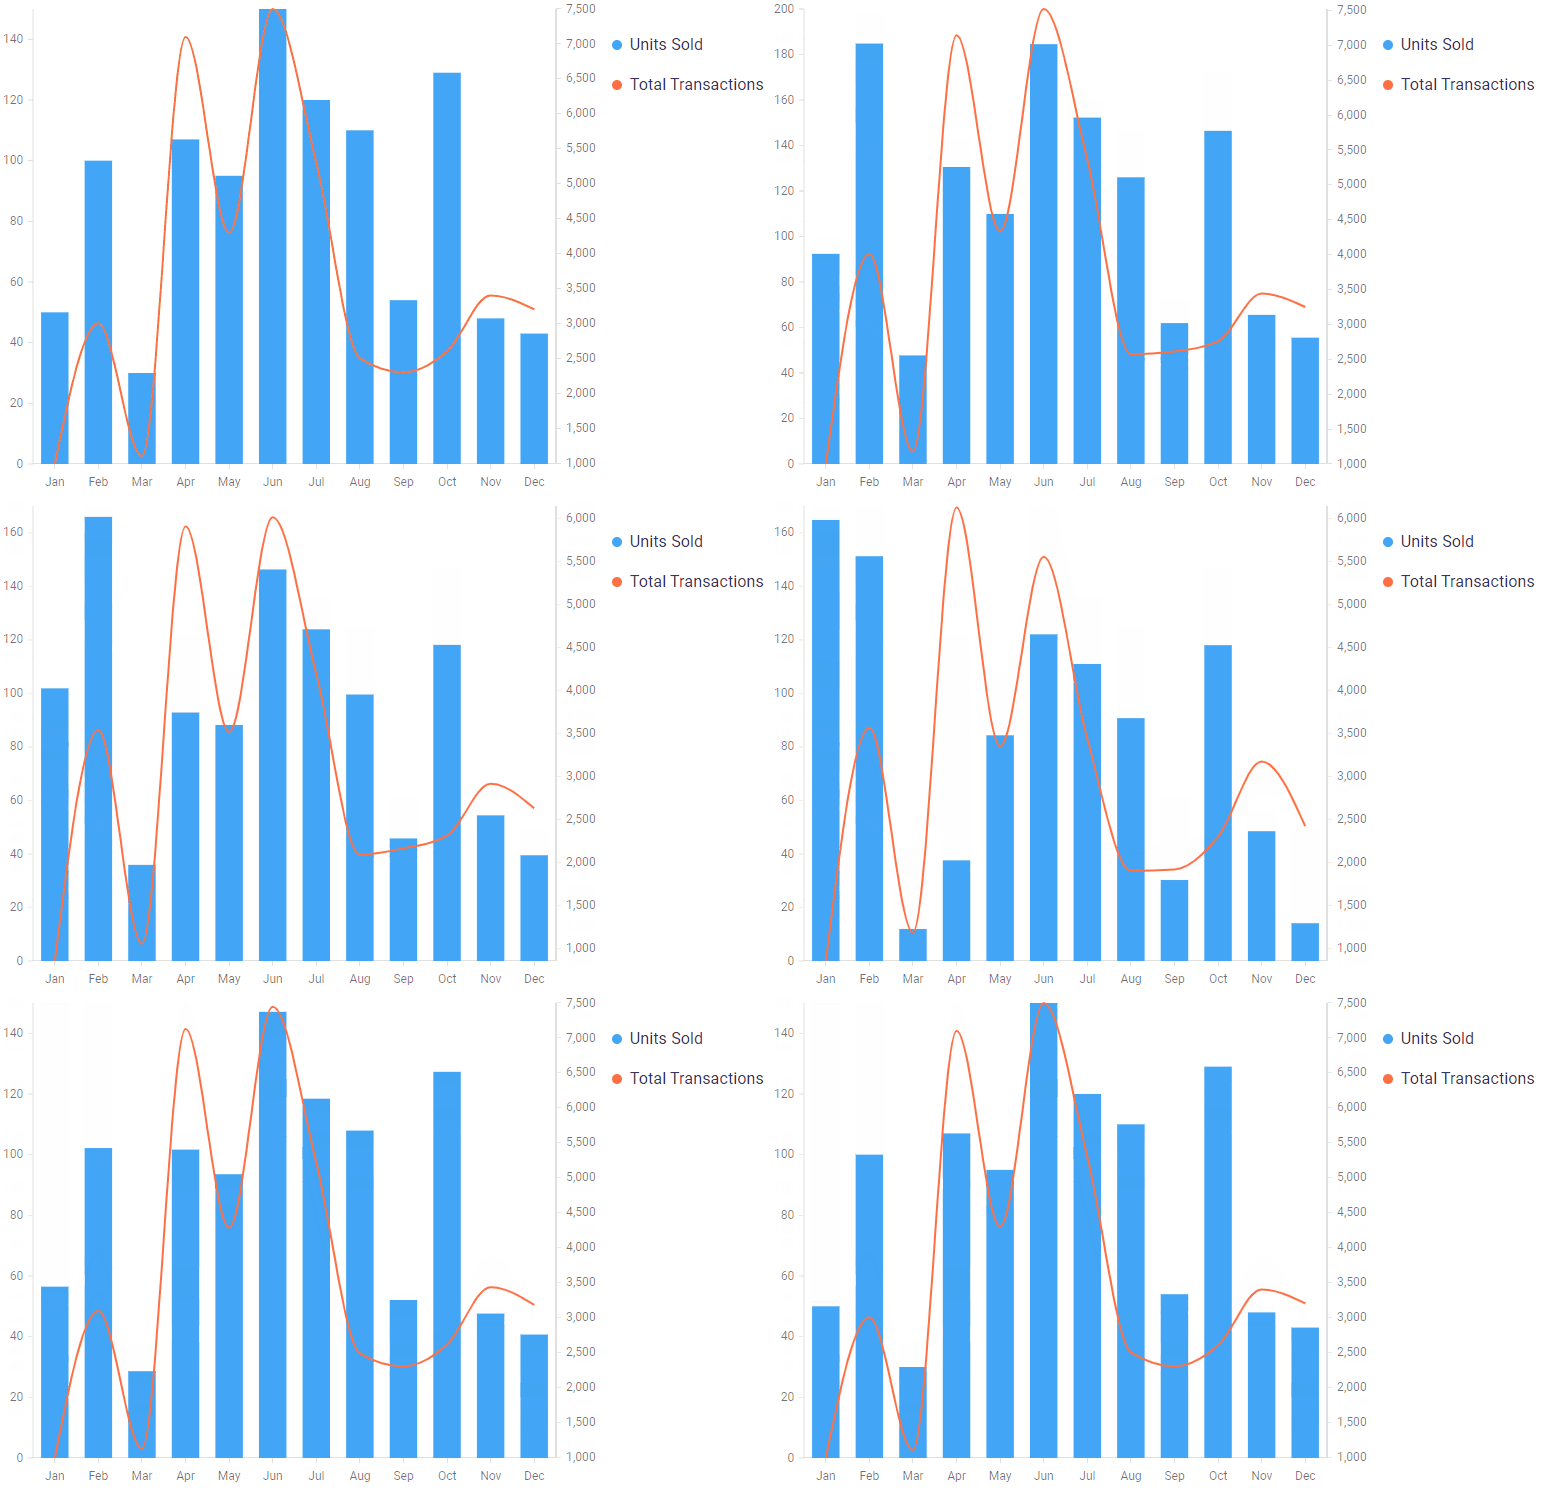
The new Animation plugin for the React Chart enables update transition animations. Once you add the plugin to your chart configuration, animations are automatically shown on data updates.

Custom Animations
You can use the two properties duration and easing to customize the animation. easing is a function, as supplied by the package d3-ease. Here is a sample chart configuration with a custom animation setup:
import { easeBounceOut } from 'd3-ease';
...

<Chart data={chartData}>
  <BarSeries
  ...
  >
    <Animation duration={2000} easing={easeBounceOut} />
  </BarSeries>
</Chart>

All Series Types Supported
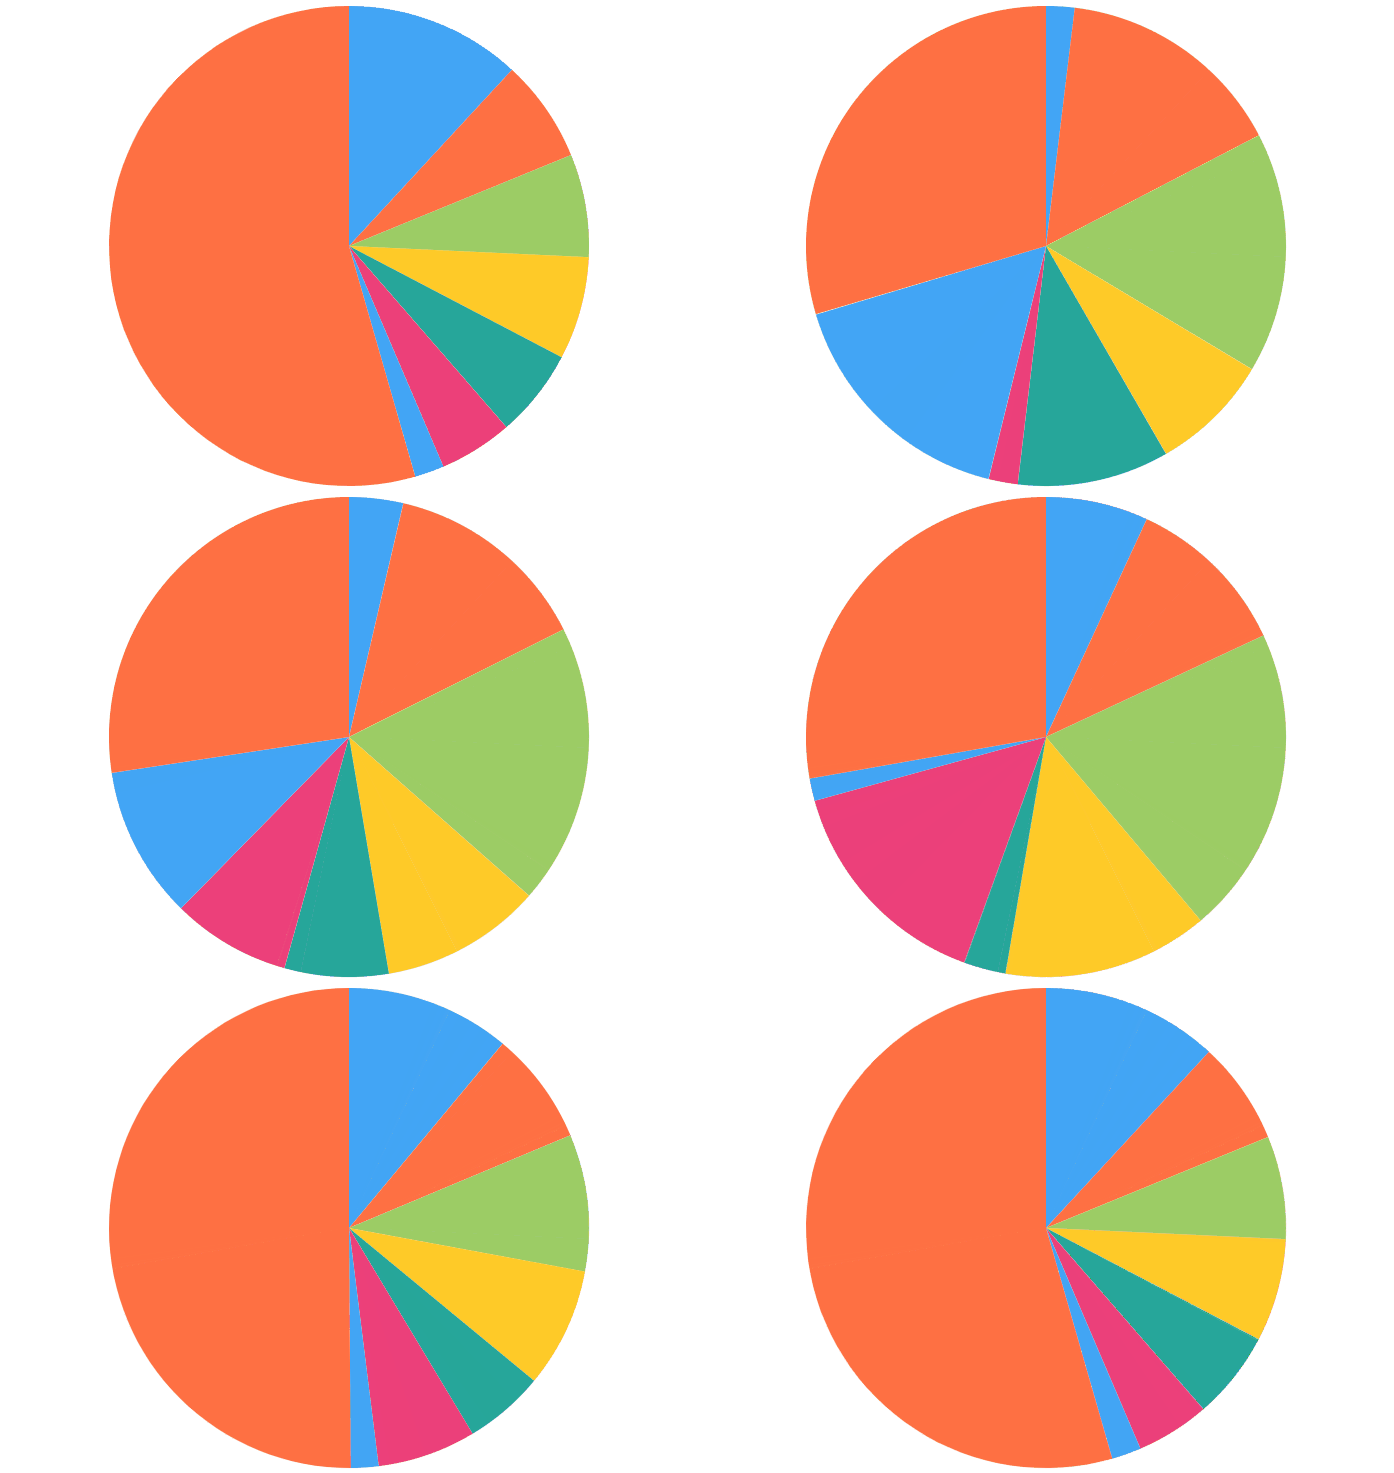
All chart series types support animation. Here is a pie chart with the Animation plugin configured.

Documentation
Please click here for the documentation of the animation feature.