Thanks to great feedback from users such as yourself, we’ve extended the capabilities of our JavaScript Chart and Gauge widgets with the following new features (v19.1).
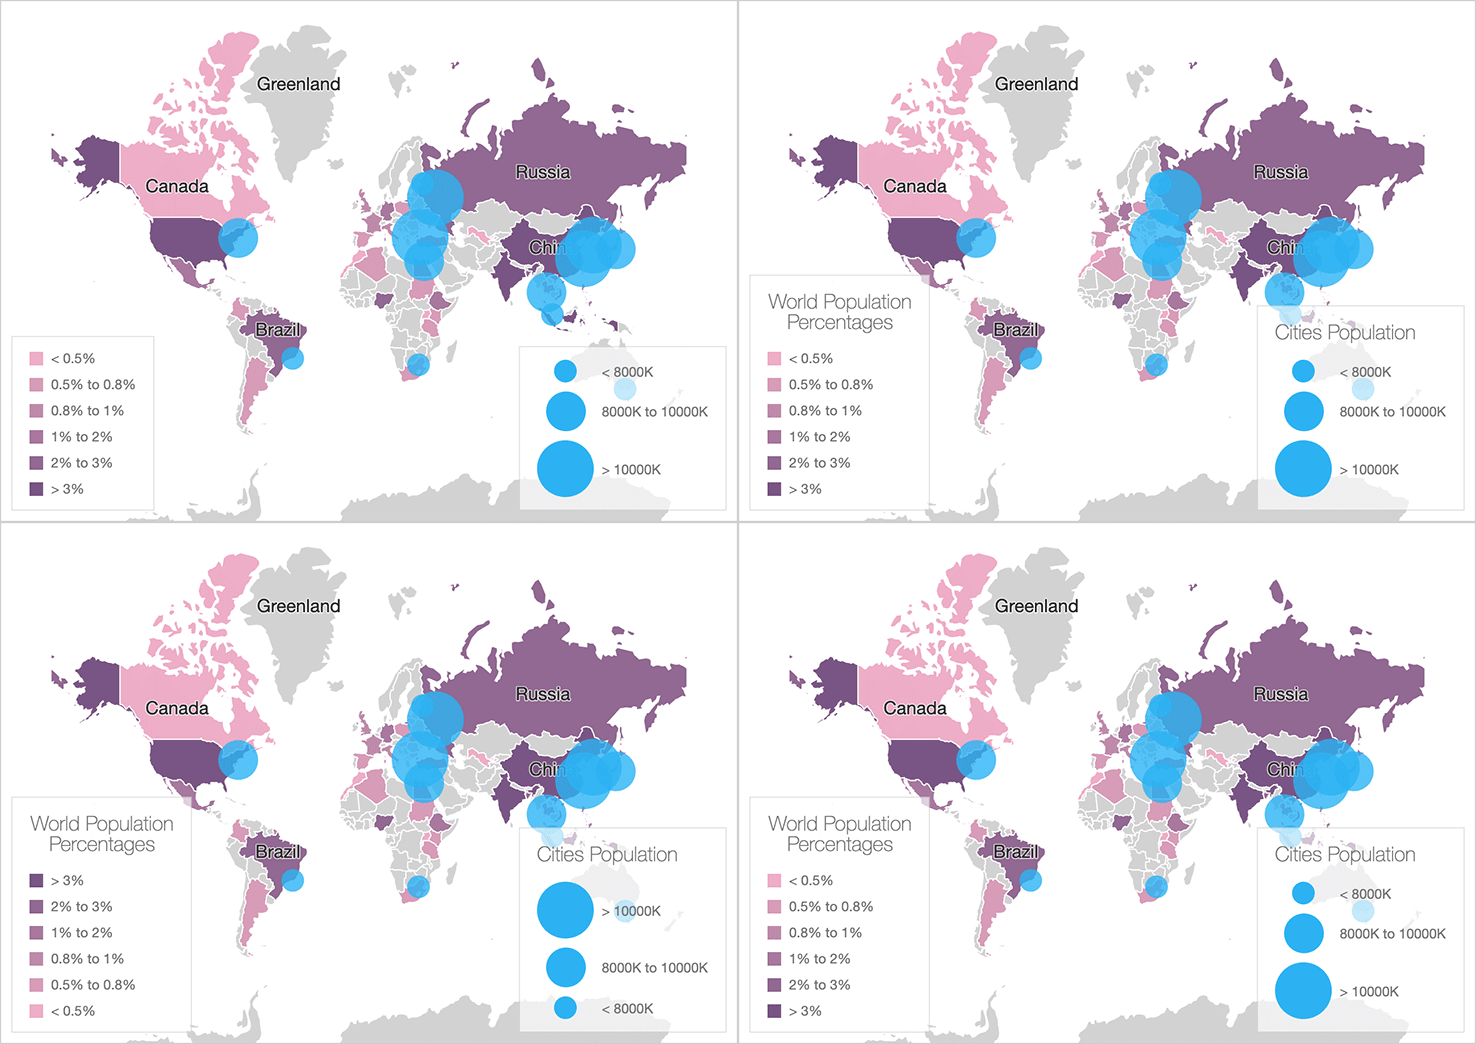
Legend
- Customize Legend Items - Use the new
legend.customizeItemscallback to change the order, text, and visibility of legend items.

Legend Title - A legend title can now be specified and configured using the
legend.titleoption. You can customize the title's appearance and its position. You can also add a subtitle as needed. This new option includes the same capabilities as the widget's root title option.Legend in BarGauge - Our BarGauge widget can now display a legend.

Word-wrap
In v19.1, we added the wordWrap and textOverflow options to enable word-wrap within the Title and Chart axis, PieChart, Funnel, and TreeMap labels.

These options are similar to CSS word-wrap and text-overflow properties. Refer to the following two help topics for more information: wordWrap and textOverflow.
Other features
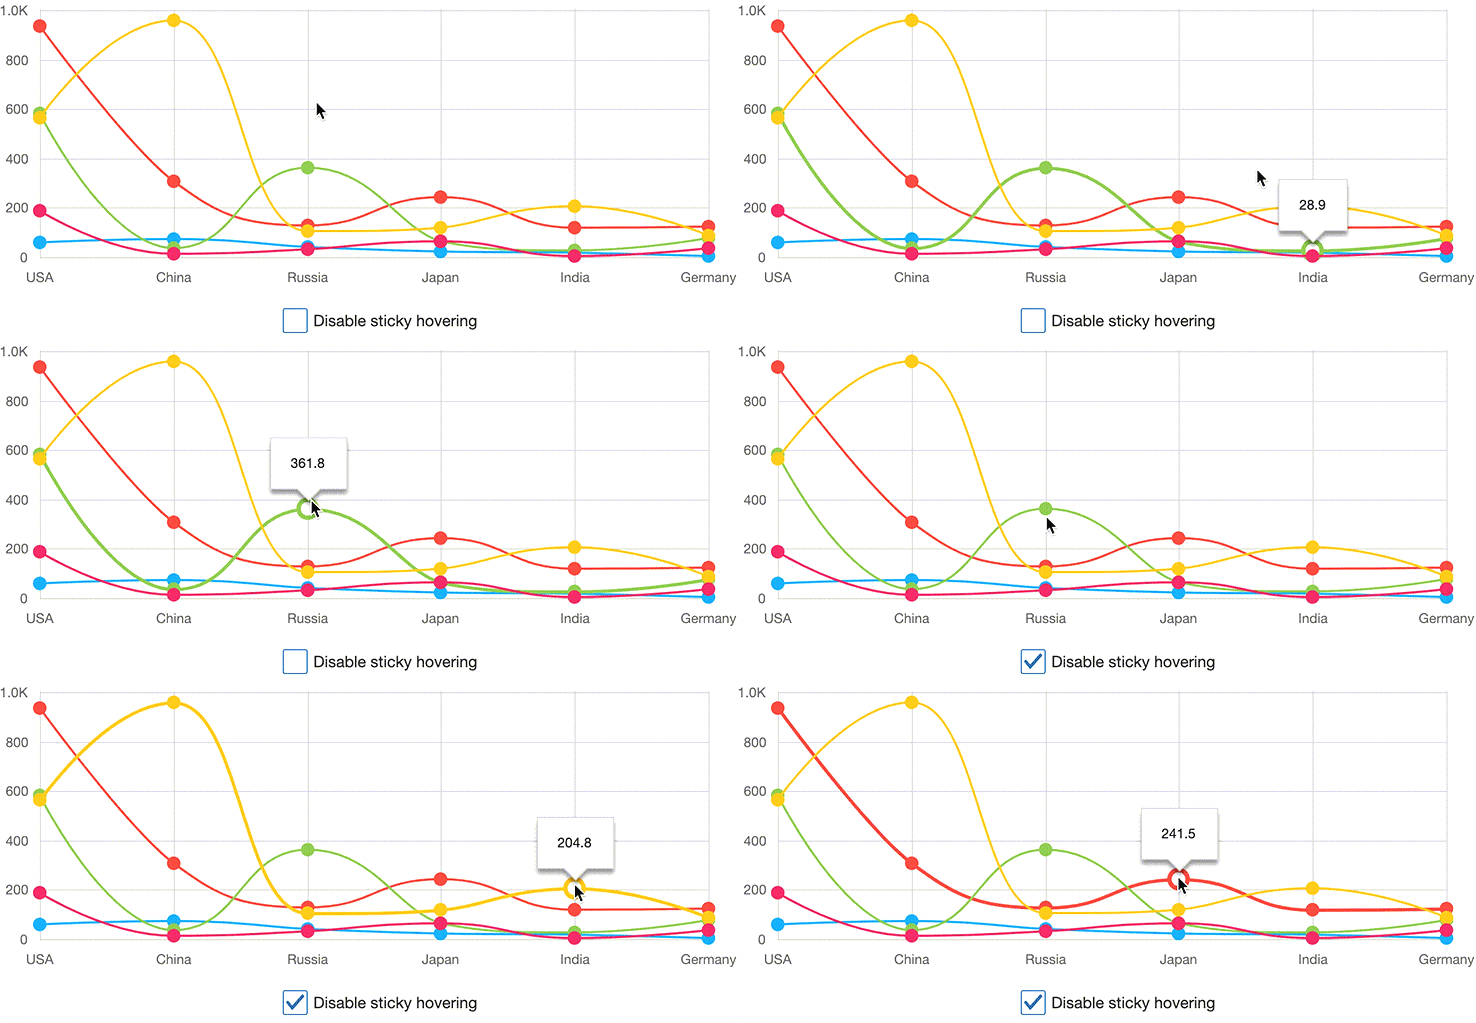
- Display a tooltip only when a point is hovered:

- Overlapped Bars - This feature allows you to create a TimeLine chart or an Overlapped Bar chart.

- Manage exported chart layout (layout by columns, etc.)
Angular, Vue, React, ASP.NET MVC / Core and more
As you know, DevExtreme supports multiple web development frameworks. All enhancements described herein are available for:Angular, Vue, React, jQuery, Knockout, ASP.NET MVC and .NET Core.
Watch the Webinar
To learn more about all JavaScript related features introduced in our v19.1 release, please watch our "New in v19.1 - DevExtreme HTML / JS Controls" webinar.
Test It Now (and provide feedback)
Test-drive the public release now. Use the npm package:
npm install --save devextreme@19.1
We’d love to hear from you – please tell us what you think about these enhancements below.