As you may already know, DevExpress Reporting (v19.1.x) ships with a redesigned Web Report Wizard. The purpose of this post is to detail its capabilities, to explain why we redesigned the wizard and to show you how you can leverage our new implementation to deliver better user experiences to your customers.
Goal #1: Reduce the Number of Report Wizard Steps
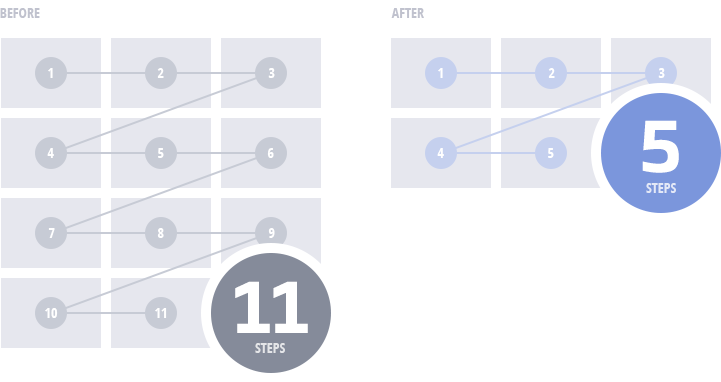
One of our primary goals during the redesign process was to reduce the number of individual steps within the wizard. To create a standard table report with groups and summaries, our old Report Wizard required users to navigate 11 pages.
We also wanted to reduce the confusion that resulted from the “modal” design of the Report Wizard. As the image below illustrates, our old Report Wizard could be confusing – users often tried to click outside the boundaries of the wizard while creating a new report.
Our new wizard is now displayed in full screen and allows end-users to focus on the new report and gives us the ability to make better use of screen real-estate.
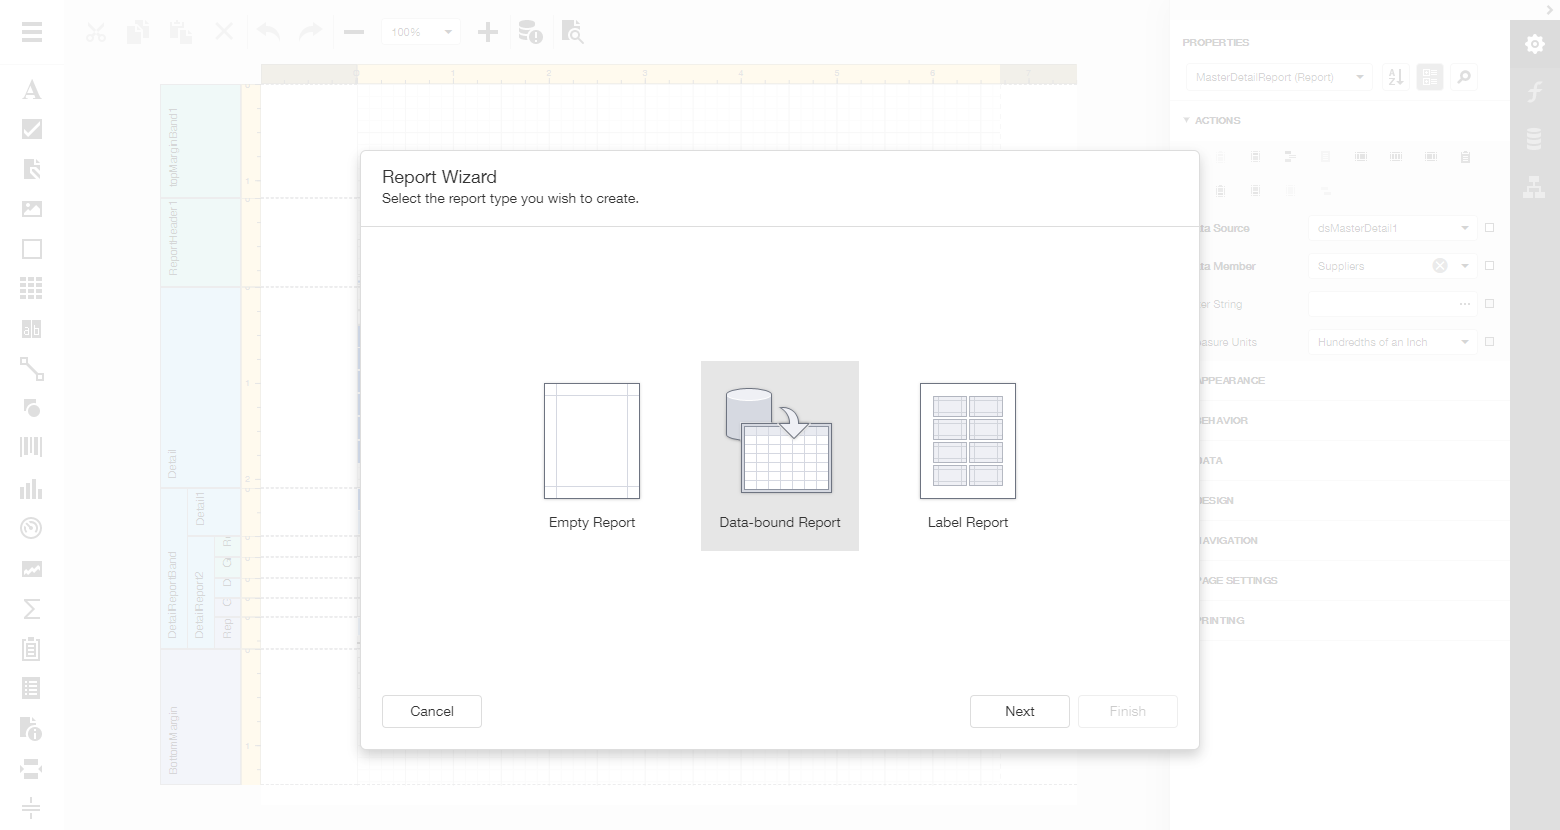
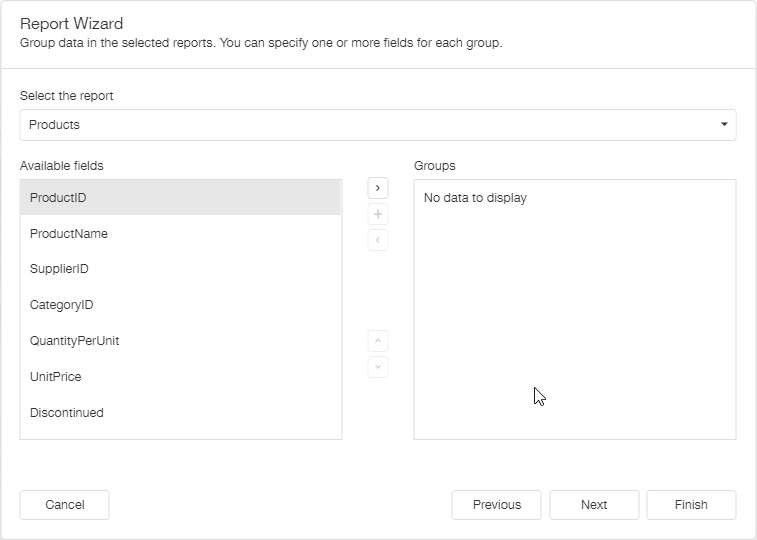
The Basic Layout of the New Report Wizard

The New Report Wizard in Action

Context-Driven UI
A report wizard such as ours makes compromises. Since its built to address a wide array of usage scenarios, it includes functionality not necessary for all reports (i.e., every report does not require data table relationships, grouping, sorting, summaries, etc.). By converting to a context-driven UI, we’ve made our Report Wizard easier to use. Much like cascading combo boxes, the Report Wizard now populates itself dynamically (based on current selection).
This new design allowed us to cut the number of wizard steps to 5. Users can now create a report in less time and with fewer mouse clicks.
Here's a comparison of the old wizard versus our new wizard:
| Time Spent (sec) | Total Clicks | |
|---|---|---|
| A master-detail report with a summary | ||
| Old Wizard (v18.2 and earlier) | 00:45 | 27 |
| New Wizard (v19.1) | 00:35 | 22 |
| A table report with a color scheme | ||
| Old Wizard (v18.2 and earlier) | 00:22 | 13 |
| New Wizard (v19.1) | 00:17 | 10 |
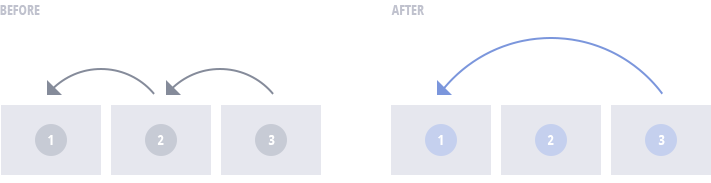
Improved Navigation Model
Standard app wizards do not offer an easy way to navigate between individual steps. If a user makes a mistake, forgets to apply a setting, or does not add the appropriate data source column, he or she must use the "Back" button to find and correct errors made in earlier steps. While this is certainly not the end of the world, it can cause unnecessary frustration and waste valuable time.
To overcome the issue, we chose to include a left navigation bar within the wizard. Your end-users can now navigate to a desired wizard page without unnecessary button clicks.
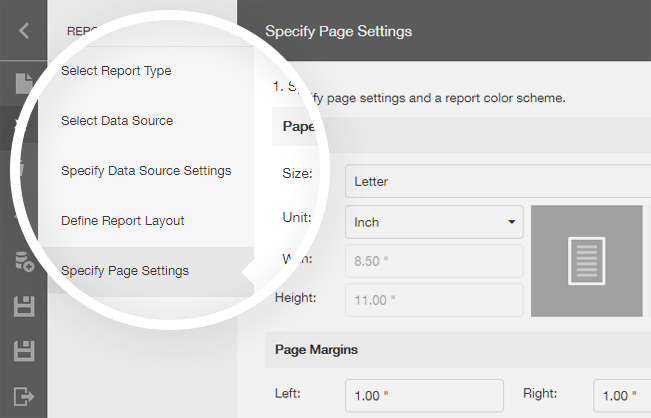
Though this may seem like a minor improvement, the net result serves our ultimate aim – reduce the number of clicks and increase overall productivity when using the Report Wizard.
User Experience Enhancements
During our redesign, we noticed a few usability issues related to our "Add Grouping" and "Add Sorting" Report Wizard pages. In our previous implementation, these pages contained a drop-down list of detail reports and a list of groups and summaries positioned below. Unfortunately, this implementation did not provide enough information to the end user and required users to change selection to add/remove a summary function or a group for a given report or its detail reports.
We redesigned both these pages, so they now appear as a listbox with two panes: a report name is displayed on the left and a grouping/sorting section with relevant properties is displayed on the right:
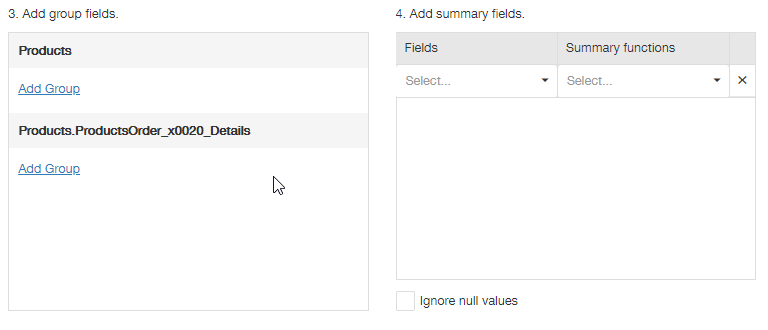
As these images help illustrate, our new approach should improve overall usability.
Your Feedback Counts
We think our new design improves overall usability and addresses a number of important navigation issues. Of course, your opinion is what counts most. Please tell us what you think of the changes described above:
Additional Changes to our Report Wizard
- The Report Wizard now allows you to create Vertical reports.
- JSON Data Source is now avaialble in the Data Source Wizard.
- You can now customize individual Report Wizard pages via our Customization API (you can find examples here). We expect to write documentation for all customization options in the near future.
Backward Compatible
If you prefer our old Report Wizard and don’t want to switch to our new design, please use the following option going forward:
protected void Page_Load(object sender, EventArgs e) {
    ASPxReportDesigner1.SettingsWizard.UseFullscreenWizard = false;
    //...
}
If using ASP.NET MVC and Core:
@(Html.DevExpress().ReportDesigner("ReportDesigner")
    .Height("1000px")
    .WizardSettings(settings => { settings.UseFullscreenWizard = false; })
    .Bind(Model)
)
If using a JavaScript-based framework like Angular:
public object GetReportDesignerModel(string reportUrl) {
var generator = new ReportDesignerClientSideModelGenerator(HttpContext.RequestServices);
var model = generator.GetModel(reportUrl, null/*DataSources*/, "/DXXRD", "/DXXRDV", "/DXXQB");
model.WizardSettings.UseFullscreenWizard = false;
var modelJson = generator.GetJsonModelScript(model);
return Content(modelJson, System.Net.Mime.MediaTypeNames.Application.Json);
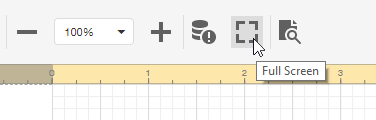
}Fullscreen Mode for Web Report Designer
We have some good news for those of you who incorporate our Web Report Designer into a container within a web application. Our next update, (v19.1.4) will include a “full screen mode” option in the Web Report Designer toolbar:
Future Plans – Your Feedback is Important
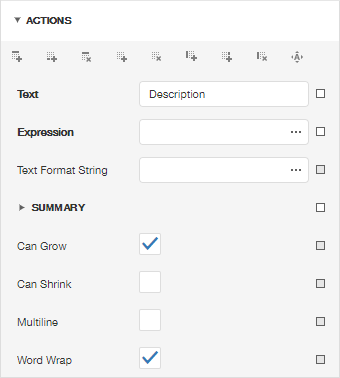
We hope to enhance the Web Report Designer further and to focus our energies on its toolbar and the properties panel. One of our ideas is to replace the toolbar with a compact ribbon similar to that used in our ASP.NET Core Rich Text Editor component:

We'd like to hide the Actions panel and move its items to ribbon tabs (which will be control-specific, and selection driven - Action panel items replicate report control smart tags you will have seen in our Visual Studio Report Designer):


![Mumford & Sons – Blind Leading the Blind – Single [iTunes Plus M4A]](http://is1-ssl.mzstatic.com/image/thumb/Music124/v4/49/c3/83/49c38304-45c6-20d0-c6df-3b36ea8bd92a/19UMGIM89194.rgb.jpg/316x316bb.webp)


