Back in March 2019, we released an early access preview of our Web Diagram control, and now, with the release of v19.1, we've upgraded it to the CTP (Community Technical Preview) level. It is getting close to a full release, and in this post I will list the latest features and discuss our future plans for the control.
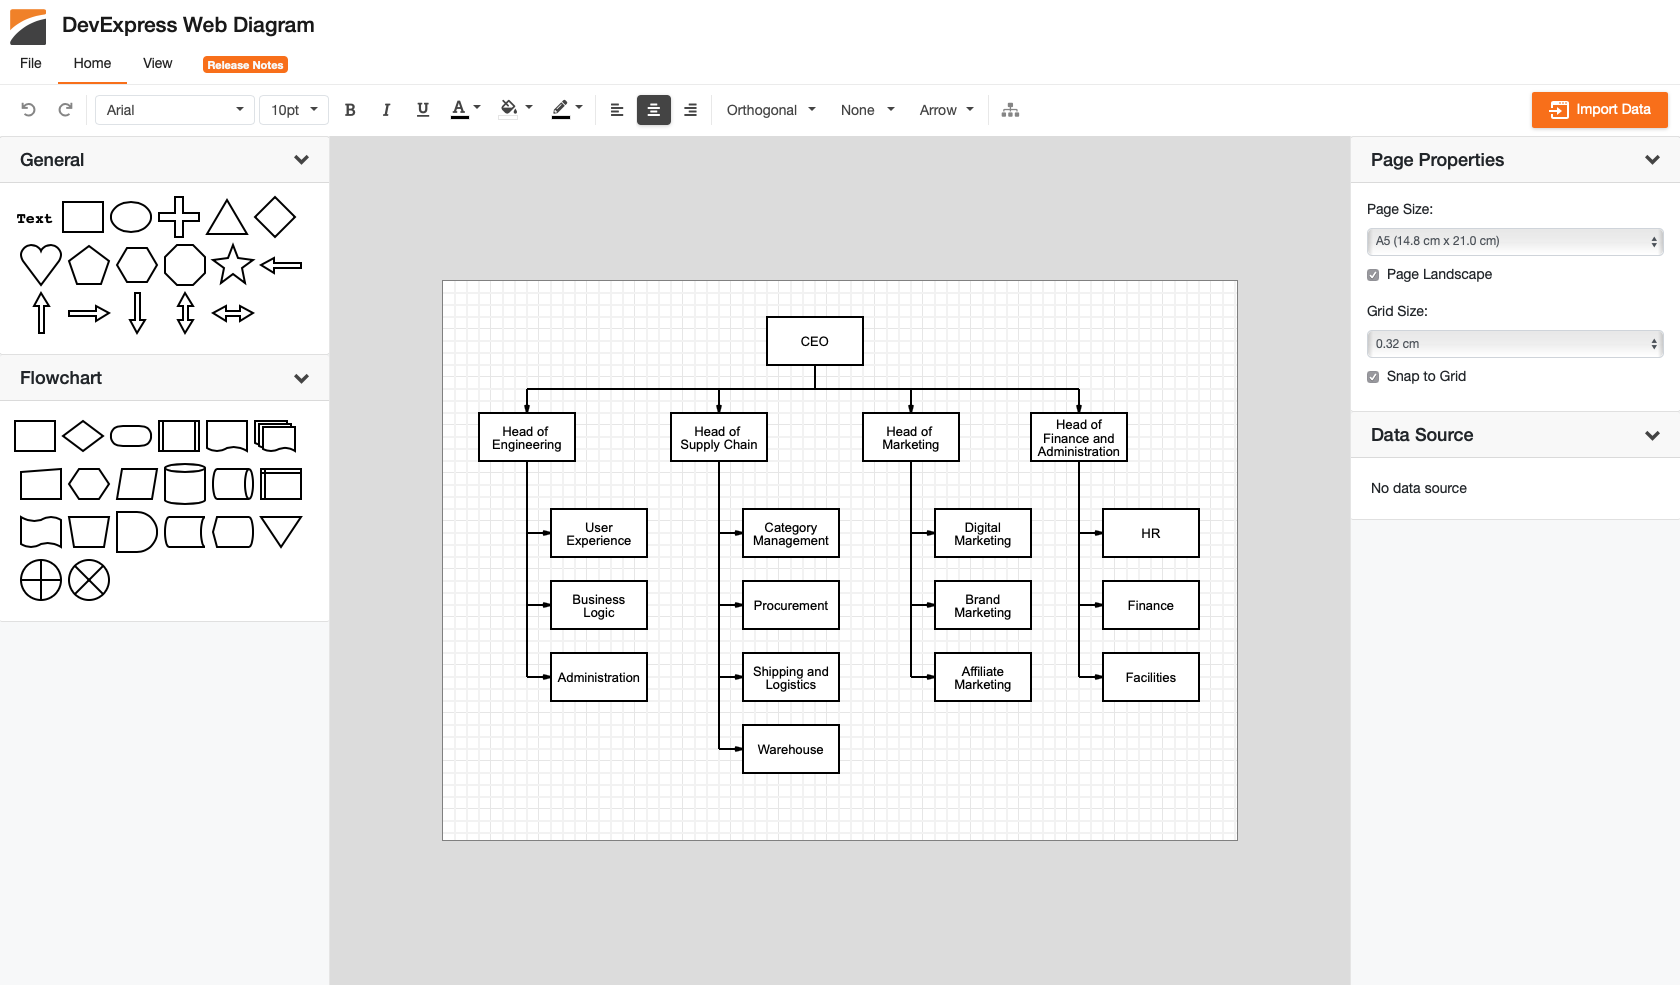
Our Web Diagram Control provides a canvas where you or your end-users can display, create, and edit various diagrams:

The core part of the DevExpress Web Diagram control is implemented in TypeScript. Consequently, all of the user experience and interactions run completely in the browser, the back-and-forth with the server is minimized. Apart from efficiency, this also gives us the benefit that we can fairly easily introduce the control for all DevExpress web platforms: DevExtreme, ASP.NET WebForms, ASP.NET MVC, and ASP.NET Core.
This CTP version provides support for two of those platforms: a DevExtreme jQuery widget and an ASP.NET Core extension built using it.
Features
Our new Web Diagram control CTP provides the following features:
- 35+ Predefined Shapes
- Custom Shapes
- Shape Sizing
- Shape Drag-and-Drop
- Auto Layout
- Snap to Grid
- External Data Binding
- Configurable Page Settings
- Customizable Shape and Connector Style Settings
- Export to SVG, PNG, and JPEG
Let's take a deeper look at some of these new features.
Load and Save
We've added an API to the Web Diagram control to load and save data:
$("#orgstruct").dxDiagram({
    onDataChanged: function(e) {
        if(e.component.isReady()) {
            var data = e.component.getData();
            // save layout data in storage
        }
    },
    // ...
    onContentReady: function(e) {
        // load layout data and apply it to the generated shapes
        var foo = window.localStorage.getItem("foo");
        if(foo)
            e.component.setData(foo, true);
    }
});
New and Custom Shapes
We've added two new shape groups: Common and Flow. These groups provide more than 35 shapes and we plan to add more shapes in future releases.
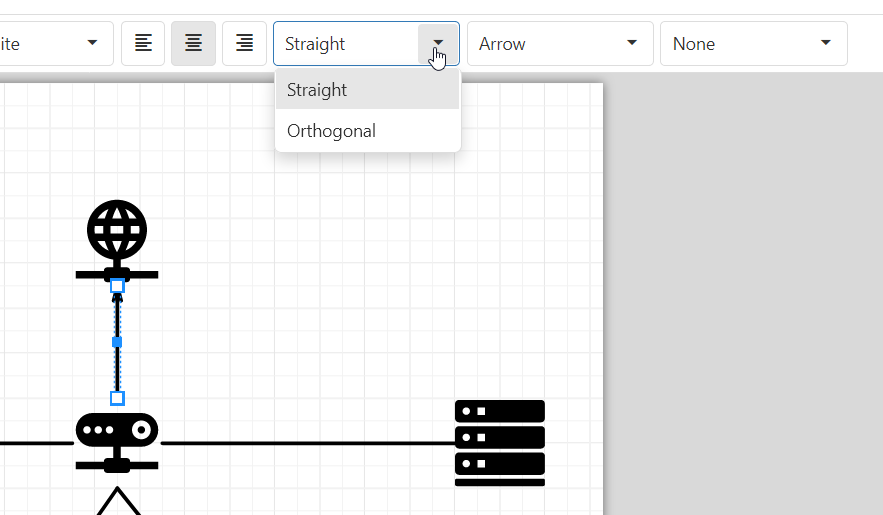
You can also import SVG images to create your own custom shapes and change their colors. Check out our 'Custom Shapes' demo which has a toolbar with three combo boxes for choosing color. These allow you to set the foreground, background, and text color for a shape or connector:
Each shape connector can display an arrow on each end. You can also customize these connectors using the toolbar:

Data Binding
With our Web Diagram control you can data bind to either:
- a graph, represented by a plain list of edges and nodes,
- a tree stored in a hierarchical JavaScript object, or
- hierarchical data stored as a plain list, with an ID-ParentID relationship.
After data binding, the Diagram control will automatically align new shapes. An end-user can re-align all the shapes or only selected shapes by clicking the Auto Layout toolbar item.
You can also create data toolbox items based on an external data source. End users can then drag data items from the toolbox and drop them onto a canvas to build a diagram.
Page Properties
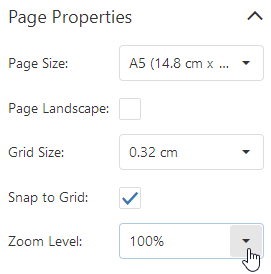
The Diagram provides several options to customize page settings for size, orientation, zoom level, and more:

Export
With this CTP, the Web Diagram control can now export a diagram to one of three image formats: SVG, PNG, and JPEG:
Plans
Please review our plans for the Web Diagram control and tell us what you think of the features we have planned:
- Create Diagram controls for other DevExpress web platforms including: ASP.NET WebForms and MVC. Web Diagram will also support other DevExtreme client-side Frameworks: Angular, React, Vue, etc.
- Add Diagram API to help you:
- handle end-user actions events (shapes/connectors clicks, editing, etc.), manage UI elements visibility and edit the diagram
- customize diagram settings, toolbars, contextual menus, panels, etc.
- interact with the diagram using external bars and widgets
- Support images in shapes
- Provide a read-only mode
- Add more built-in shapes and shape packs
Feedback
Please take a moment to answer the question in this short survey:
Thank you.