We implemented several enhancements for our End-User Designers in v19.1. This post summarizes the new functionality. All features described below are available in the WinForms End-User Designer. Several are also available in the designer for WPF, they are highlighted specifically.
External Drag&Drop Operations and Clipboard Support
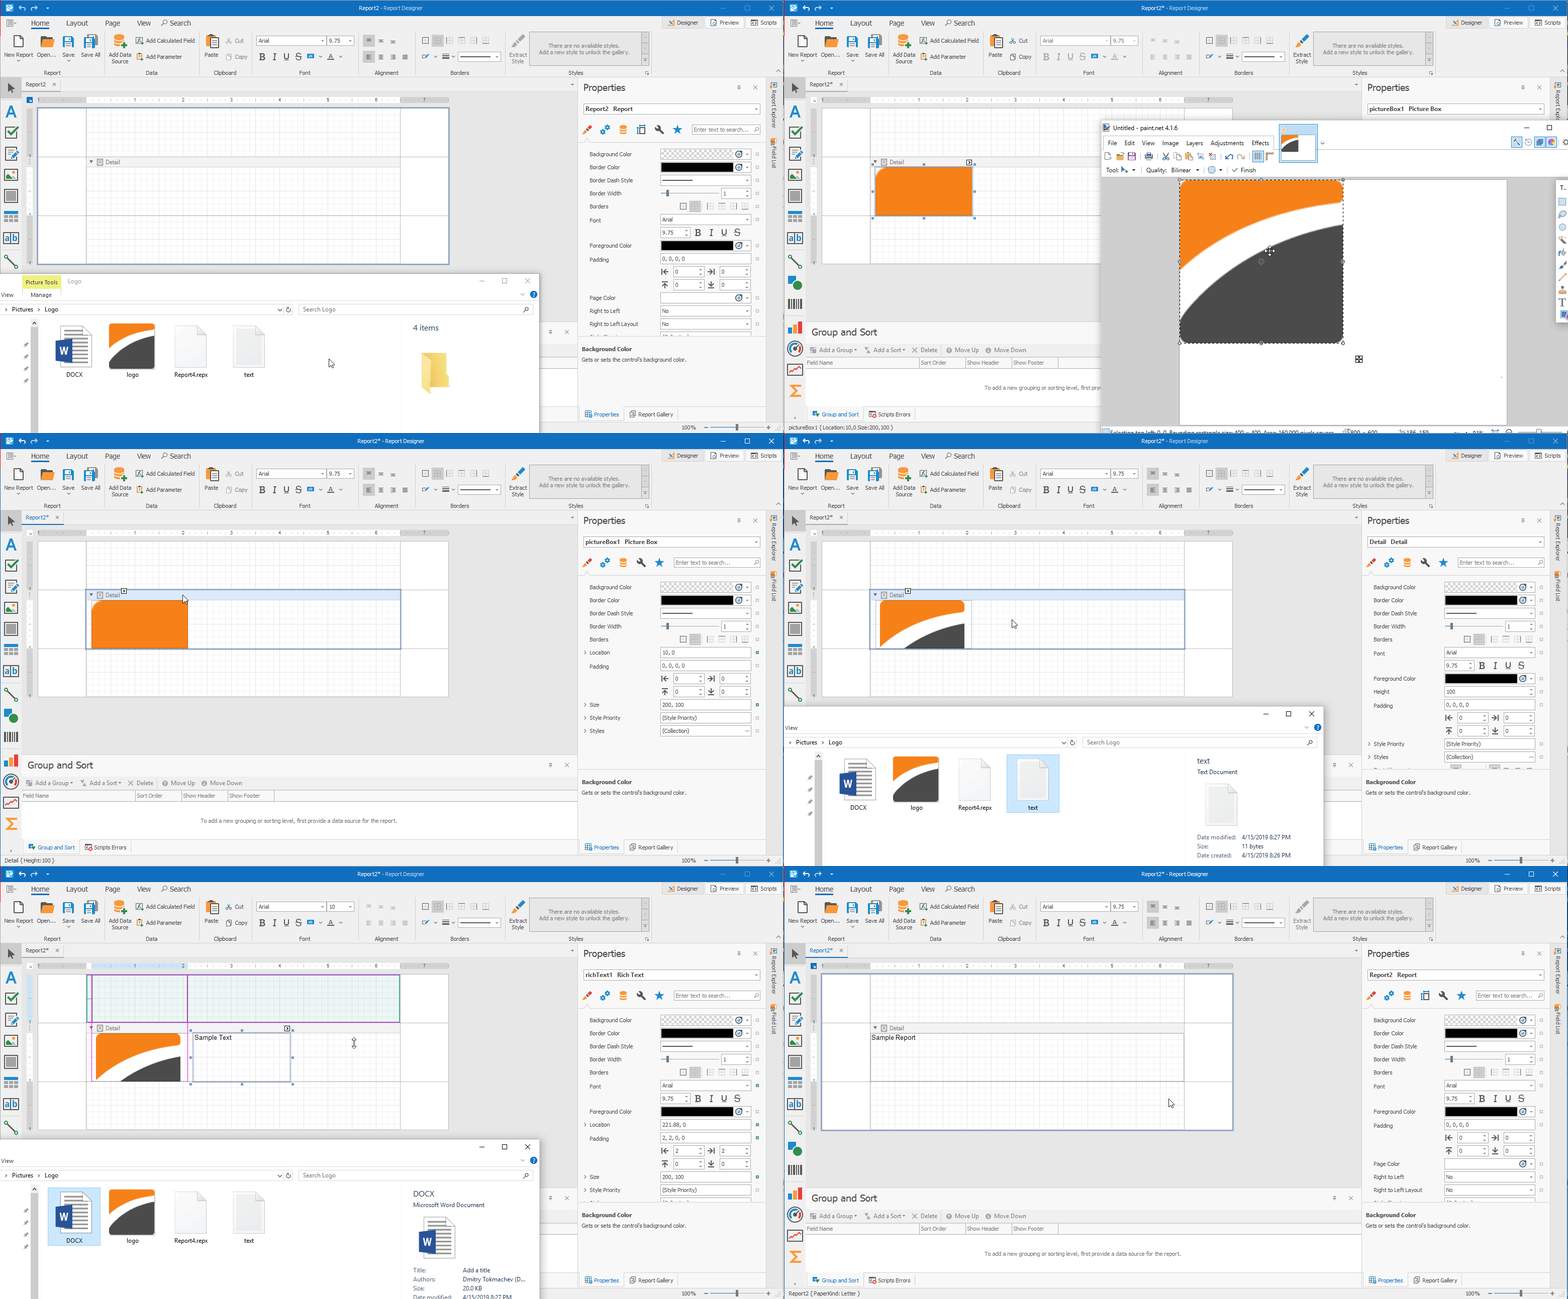
Both the Visual Studio Report Designer and the WinForms End-User Report Designer now support external drag&drop operations and clipboard interaction:
- You can paste an image file from the clipboard, or drop an image onto the design surface to create an
XRPictureBox - You can select an
XRPictureBoxand copy its image to the clipboard, then paste it elsewhere - Dropping or pasting files of types
.txt,.rtf,.docxand.htmlcreates either anXRLabelor anXRRichText - Drop a report definition file onto the Report Designer to replace the layout of the current report
This video shows the operations in action:
SVG Validation
If an SVG image is loaded that contains tags which are not yet supported by our parser, a message box with details is displayed:

Similar messages are displayed in the Visual Studio debug output window if you use API methods to load images at runtime.
Summary Editor Form
This feature is also available in the WPF Report Designer.
You can now create a simple summary directly in the Summary Editor, without the need to open the Expression Editor.
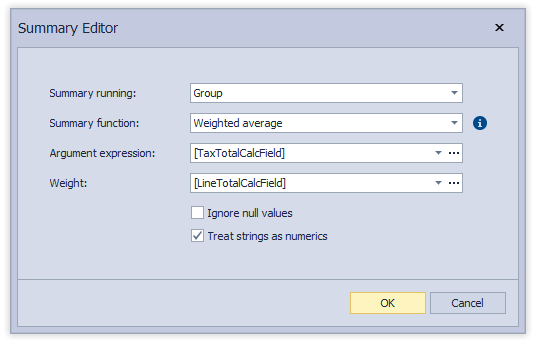
Weighted Average Summary Function
As you can tell from the image above, the summary function Weighted average is now available out of the box. We would like to add more built-in summary functions, so please let us know which functions you are missing:
Default Page Settings For New Reports
The XRDesignMdiController class now includes the property DefaultReportSettings with various nested items: ReportUnit, PaperKind, PageWidth, PageHeight, Landscape, RollPaper, Margins. The End-User Report Designer takes all these into account when a new report is created using the commands New Report and New Report via Wizard.
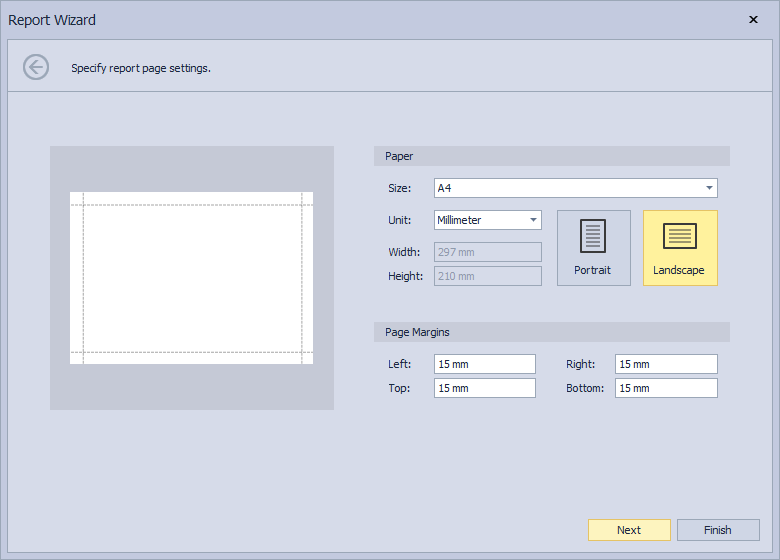
Please feel free to leave a comment below if you need to specify any other default report settings.
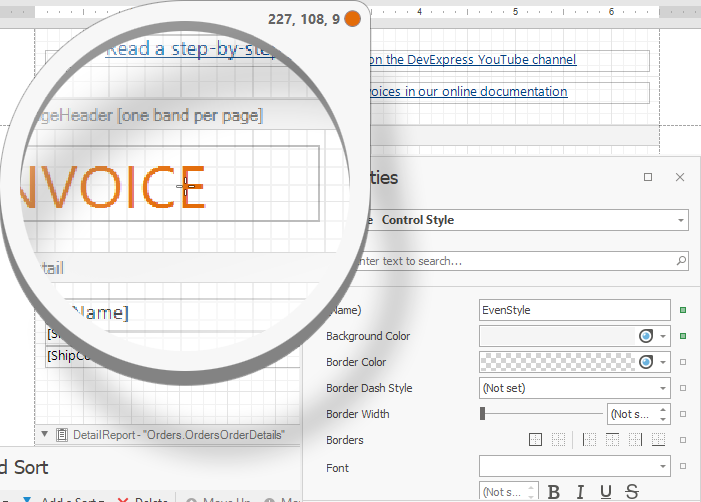
Magnifier Button For Color Properties
All color property editors now include a magnifier button. Click this button to invoke the Magnifier Dialog where you can pick a color from any screen pixel. This is useful to quickly create a common style for several controls, or to pick the color of a template image pixel when viewing it side by side with the Report Designer.
New Tab For The Properties Window
This feature is also available in the WPF Report Designer.
Page Settings are now available on their own tab in the Properties window for a Report object, to make them easier to discover:
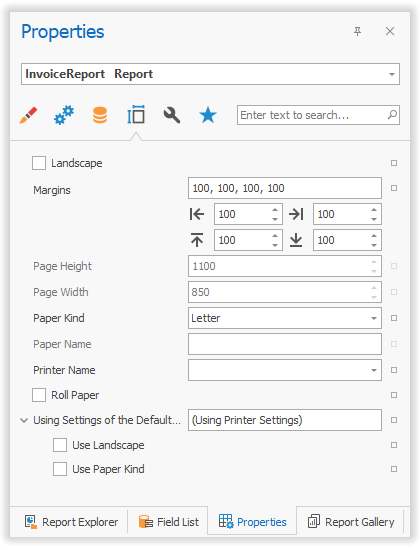
We are interested in your feedback about discoverability in the Properties window. Do you think the current tab icons speak for themselves? Do you have ideas for improvements?
Expression Property Tooltips
This feature is also available in the WPF Report Designer.
Finally, another small change to make settings more discoverable: when a property has an expression assigned, this expression is displayed in a tooltip when the mouse hovers over the property editor. No need to open the Expression Editor anymore for simple cases!
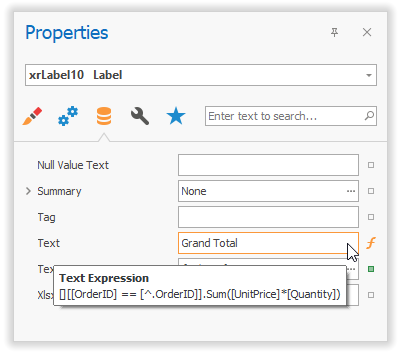
Please Let Us Hear Your Thoughts
Most of the changes described above were made on the basis of your feedback. Please let us know if you have any new ideas or comments on the new features.
Webinar
Please use the link below to register for our upcoming webinar on Dashboards, Reporting and Data Analytics, where all new features the the v19.1 release are demonstrated.
Register for the Dashboards, Reporting & Data Analytics v19.1 Webinar