With version v1.10.0 of the DevExtreme Reactive components we published a Beta version of the React Chart.
We have worked hard to finalize the feature set since our CTP release. Detailed documentation can be found here and demos of most chart types are also available.
Here are some of the latest features we added.
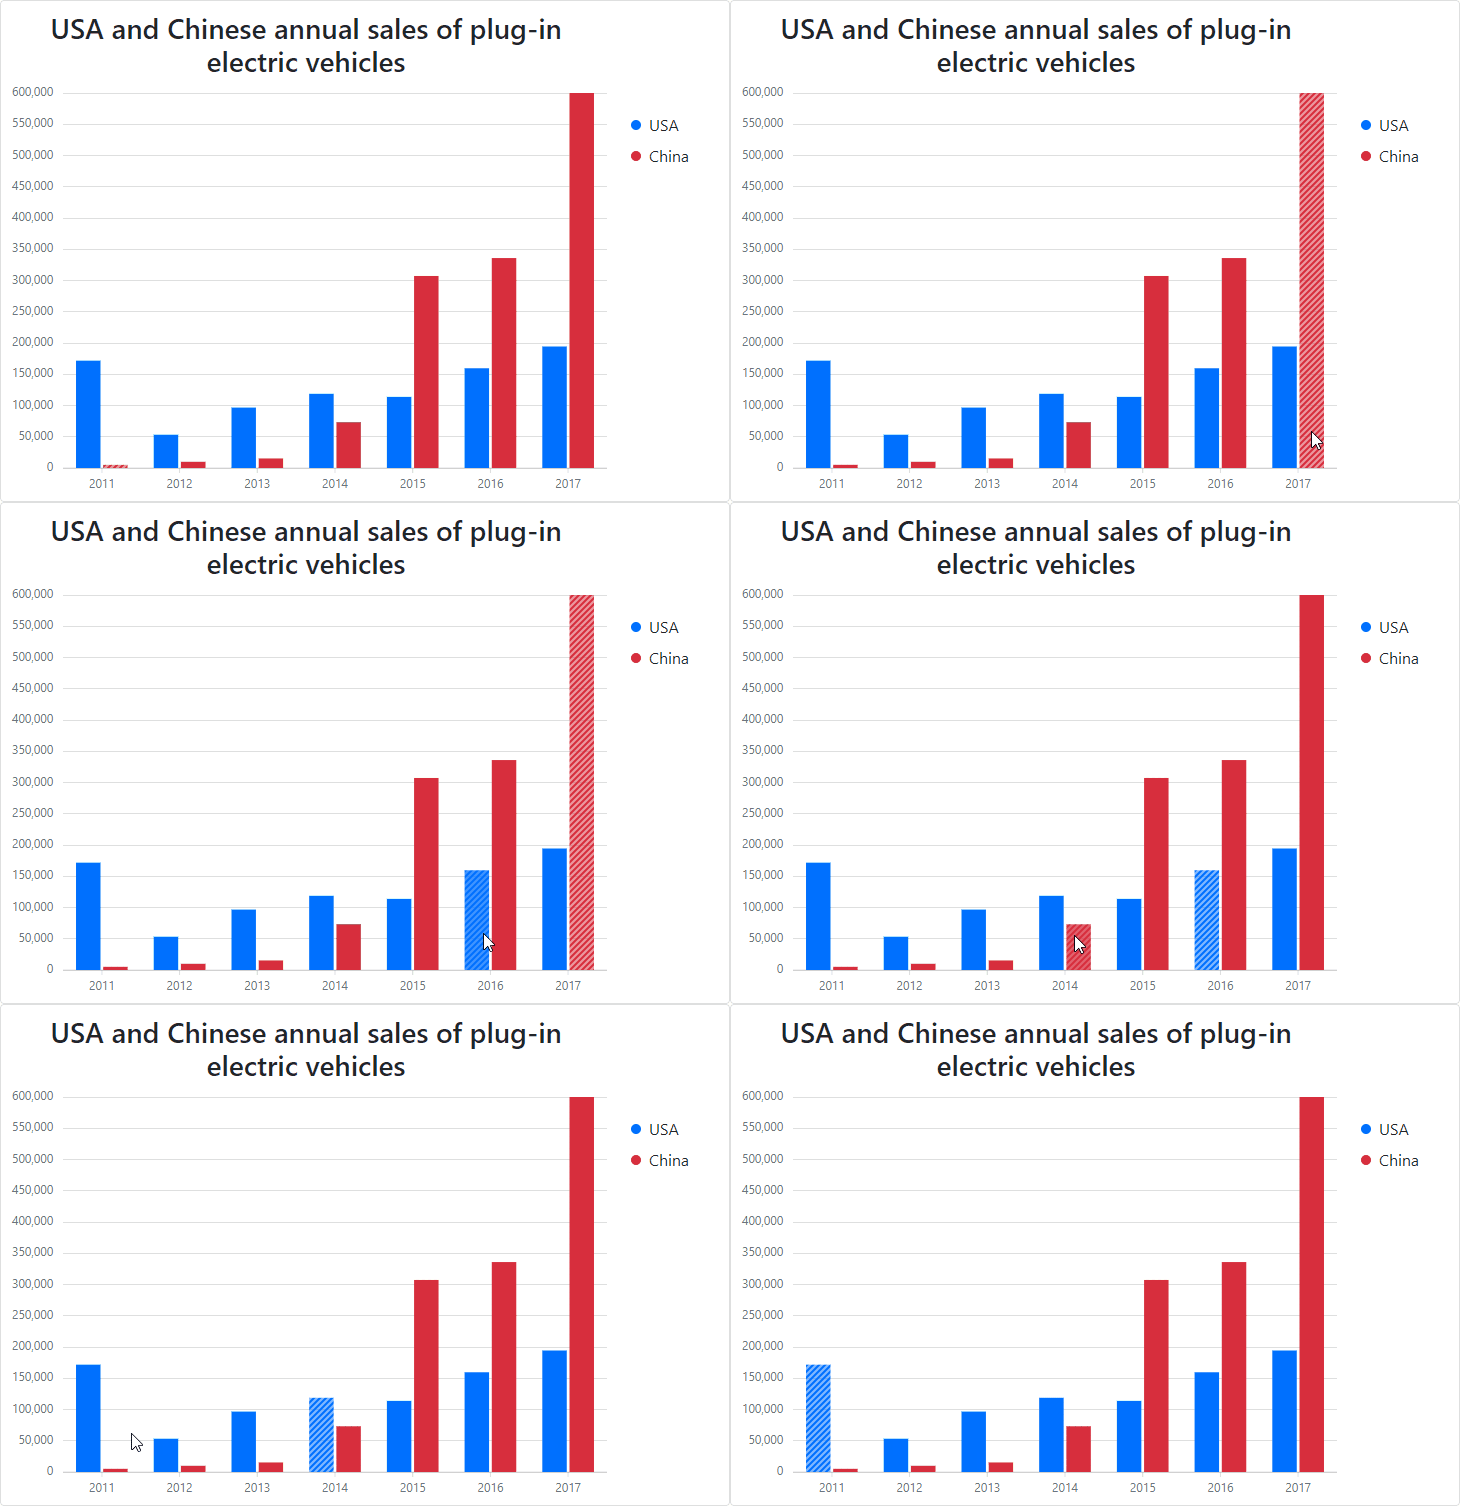
Hover And Selection
Series points can be in hovered and selected states. This is supported by the EventTracker plugin in combination with one or both of the HoverState and SelectionState plugins. Other plugins can take advantage of this state information, or you can use it yourself in your code.

Documentation and samples for these features are available here.
Tooltips
The Tooltip plugin makes it easy to show values of series points when the mouse hovers over them – or any custom information!

Documentation and samples for the Tooltip plugin are available here and this demo shows an example of a customized tooltip.
Reveal Animation
The Animation plugin animates chart series when they are first displayed. It is possible to modify animation options by implementing custom Point components, as demonstrated on the documentation page for the feature.

Try The Chart Now
The Beta is available now. A few simple npm or yarn commands get you started, as described here.
Let Us Know Your Thoughts
We are very interested in your comments! Please feel free to reply below or to open a Support Center or GitHub ticket for detailed discussion. We would appreciate it if you’d submit your responses to this quick survey: