We have good news for those of you who need to update data in DevExtreme Charts dynamically. Before v18.2, live data updates reset zoom and pan parameters. With our new Visual Range support, real-time updates can be applied correctly and efficiently while the user interacts with the chart.
The new functionality described in this post applies to all platforms supported by DevExtreme, including Angular, Vue, React, jQuery and ASP.NET MVC and ASP.NET Core.
Introducing the Visual Range
Both argument and value axes now have a visualRange property. This defines a subset of the wholeRange. If zoomAndPan settings are configured and the user scrolls or zooms the chart, the Visual Range changes accordingly.
When data updates are applied, the chart handles the Visual Ranges depending on the new property visualRangeUpdateMode. The argument axis supports four different scenarios for this property.
First, by setting visualRangeUpdateMode to reset, you bring back the behavior of pre-v18.2 charts. When data is updated, the Visual Range of the axis is reset to show all data.
Second, the setting keep means that the Visual Range doesn’t change at all. New data added to the chart may not be visible until the user zooms or scrolls to the relevant part of the chart.
Third, shift can be used to automatically follow values that are added to the end of the chart data. The Visual Range remains the same length in this case, but is moved to include newly added elements at the end.
Fourth and last, the default option auto combines the other three values depending on circumstances. When a data change occurs in this mode, the position of the Visual Range on the axis is considered. If the user is currently viewing a part of the chart that does not include the end – i.e. any part at the start or in the middle of the Whole Range – the keep behavior will be applied and the Visual Range remains unchanged. If the Visual Range is at the end of the Whole Range, shift behavior is used, and if Visual Range and Whole Range are equal, the chart behaves as described above for the reset setting.
For the value axis, the reset and keep settings are supported equally. The auto option observes the results of the evaluation for the argument axis. If the argument axis is going to keep its Visual Range, the value axis also applies keep. For reset or shift on the argument axis, the value axis uses reset.
auto modes for both axes cover a very broad range of scenarios, with edge cases supported by detailed settings for one or both axes. We are very interested in your comments, especially if you have a use case that may not be covered yet!
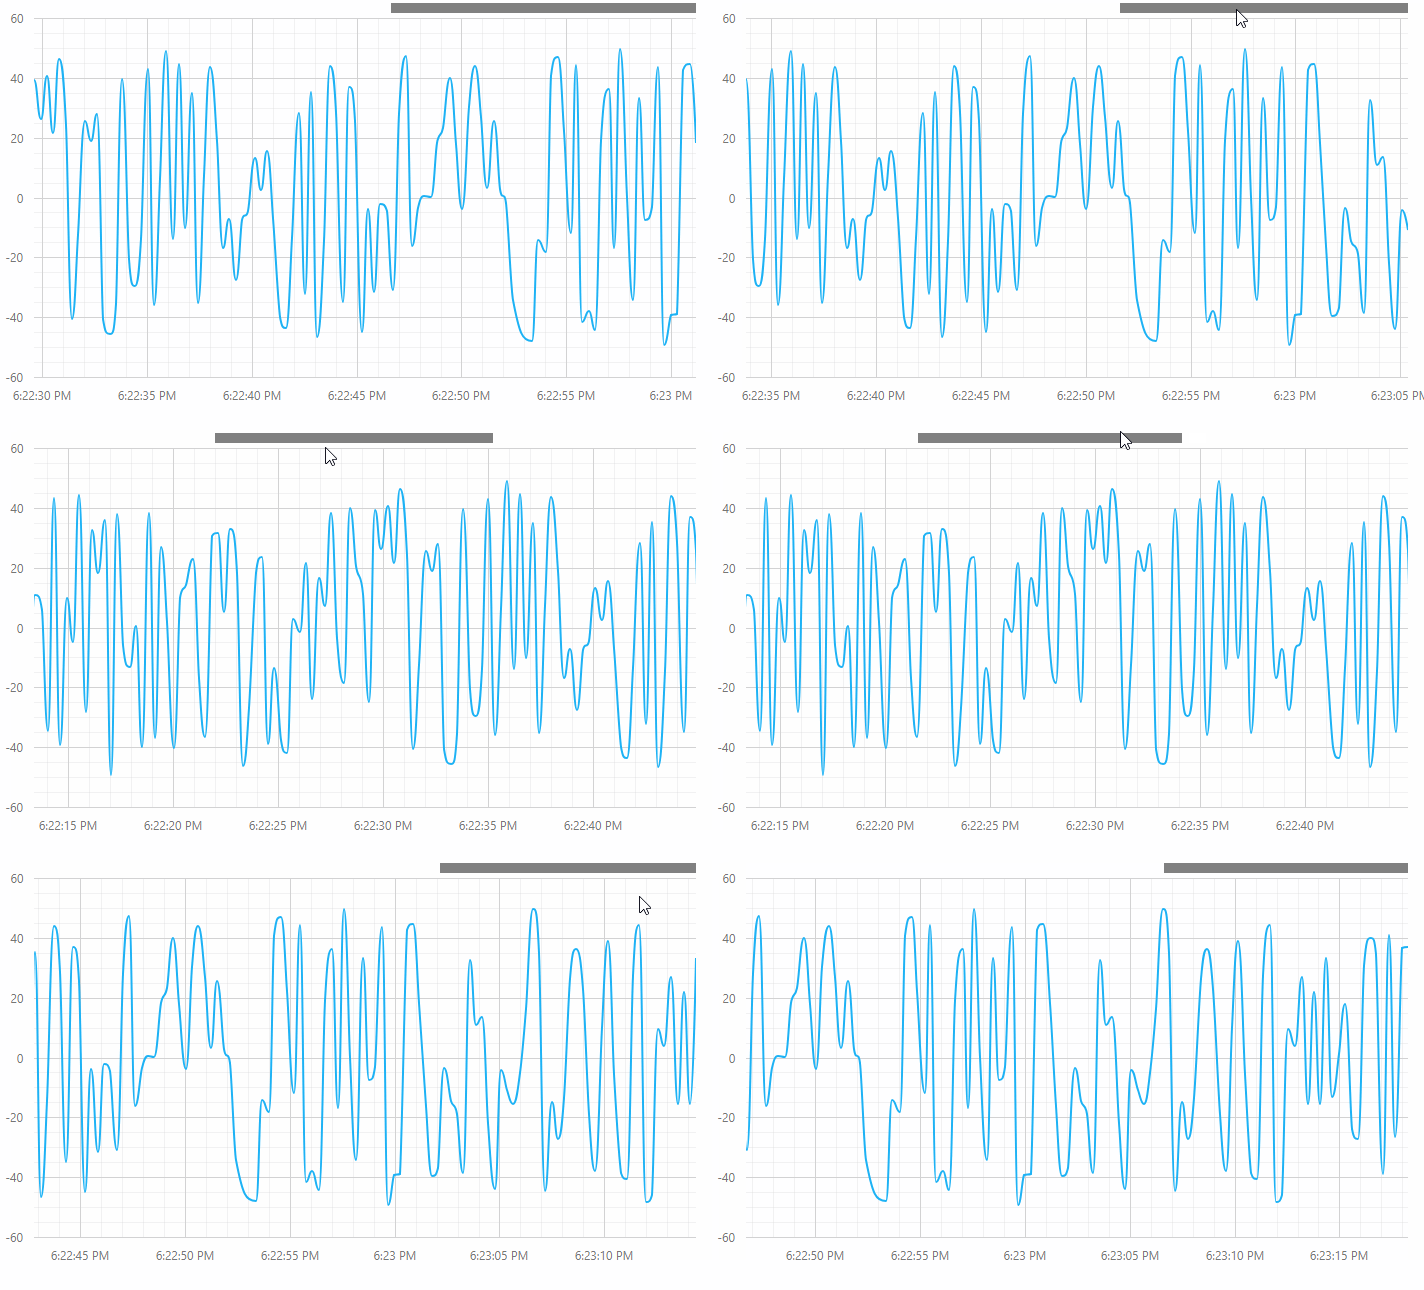
The following image illustrates live updates in auto mode.

This demo shows auto mode together with aggregation and live data updates. Note that due to the aggregation being applied, value updates are first reflected in the right-most element, with scrolling applied after a short while. Try to scroll and zoom the chart and see how it manages the Visual Range!
Let Us Know Your Thoughts
As always, we’d like to hear from you. Do you use live data updates in charts in your apps? What do you think about the new features? We’d appreciate it very much if you could submit this short survey: