Since the initial release of our Native Charts for iOS, Android and Xamarin last year, we received numerous requests about support for the Xamarin.Forms platform.
The v1.1 CTP release of Native Charts now offers this support, speeding up cross-platform development with a common user interface for multiple platforms. All you need is to do is install Visual Studio on your Mac or Visual Studio 2017 IDE with Xamarin support on your PC.
We have published a Knowledge Base article that includes a Quick Start guide and links to Xamarin.Forms examples illustrating some of the new features from the upcoming major update.
If you are an active Universal subscriber and would like to try the CTP version prior to its official release, please email our support team at support@devexpress.com or create a private ticket in the Support Center. With that, we can verify your account and provide you with a preview package privately.
If you are using a trial version and want to try new features today, you can purchase a DevExpress Universal license online (this will give you access to early builds such as this CTP). If you own a non-Universal subscription and are ready to upgrade, email us at clientservices@devexpress.com for preferential upgrade pricing.
Now, here’s a quick overview of the new features (note that these features are not specific to the Xamarin.Forms platform and supported in native libraries as well).
Indicators (Calculated Series)
Indicators are widely used for technical analysis and very common in financial charting. Our desktop charts support most common indicators and allow developers to quickly and efficiently provide analytics features in charting applications.
For our mobile charts, we added a special Series type that can use other Series as data sources.
There are 19 indicator types available out of the box (Moving Average, Envelope, Bollinger Bands, and others).

The screenshot shows two indicators (Bollinger Bands, Simple Moving Average) in a Candle Stick chart.
Pie (Doughnut) Chart Center Label
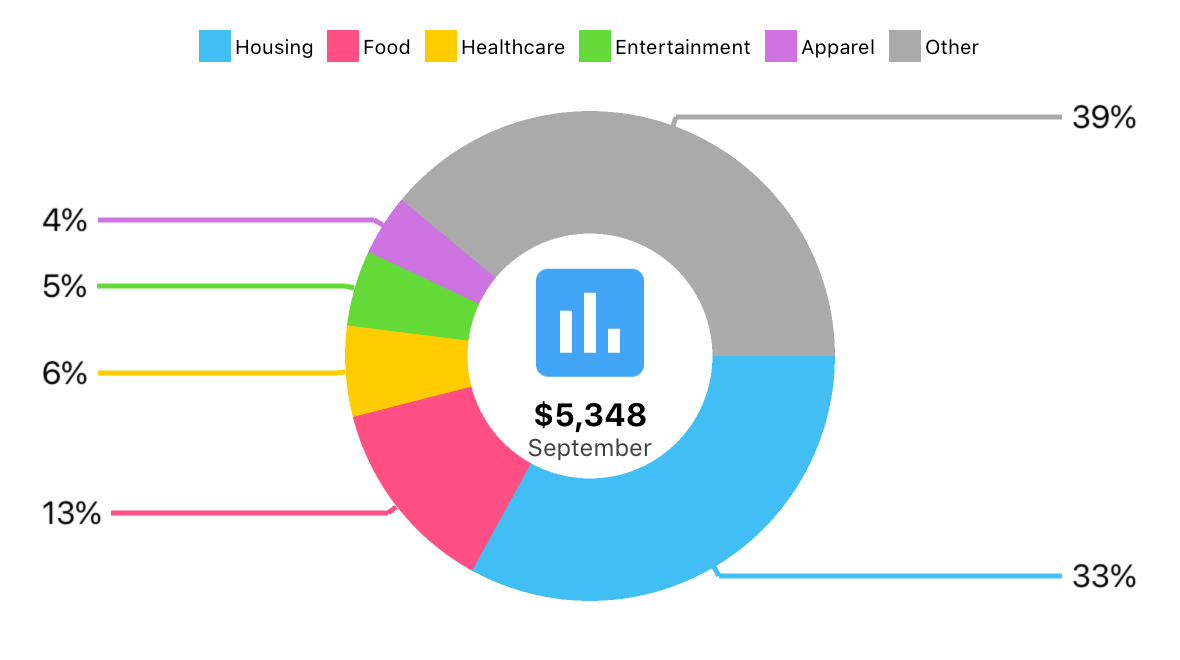
This feature has also been taken from our desktop charts where it has proven valuable. With a Center Label, you can display a total value, or even an arbitrary piece of information, in the middle of the Pie (Doughnut) element.

The Pie Chart supports both Image Center Labels and Text Center Labels out of the box. If necessary, you can implement a custom Center Label layout.
As usual, we appreciate any feedback that helps us improve the component API before the official release. Please feel free to leave a comment in the KB article or post a ticket in Support Center.