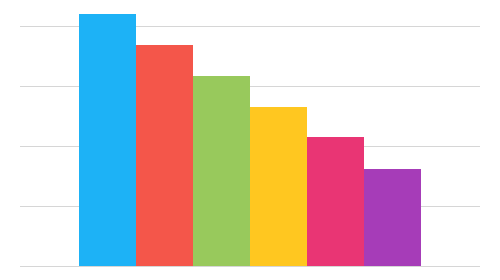
The DevExtreme Data Visualization widgets (i.e. charts) have added some notable improvements in our next major release, v18.1.

New "Material" Palette and Palette Extension Modes
DevExtreme Data Visualization widgets made their debut back in 2013. Since then, the idea of how a modern application should look has evolved. Unfortunately, our chart's default appearance remained the same.
You may have read about the new "Material" theme in the DevExtreme library. Well, we're introducing a new "Material" palette and palette extension modes for the DevExtreme charts too. And it looks fantastic. Here's a comparison of the old on the left and new "Material" palette on the right:

The "Material" palette uses bright colors associated with Material Design and it's now the default palette for DevExtreme charts.
Extension Modes
There's also a set of new palette extension modes. They apply when a chart has several series and the number of colors in a palette is insufficient to draw each series in a different color. Previously, the widgets would only use the alternate mode. Now you can choose between three modes: alternate, extrapolate, and blend:
Alternate Mode
Repeat the full set of palette colors, alternating their normal, lightened, and darkened shades in that order.
Extrapolate Mode
Repeat the full set of palette colors, changing their shade gradually from dark to light.
Blend Mode (used by default)
Create a blend of two neighboring colors and insert it between these colors in the palette.
Setting the paletteExtensionMode option to alternate, extrapolate, or blend specifies the mode.

New Bar Width and Bar Padding API
Customer feedback is valuable to us, in fact, based on use-cases provided by you, we're also adding these new charting features:
- Specify different bar widths for different series
- Specify padding for a group of bars associated with the same argument
- Specify the fixed/relative bar width
- Specify the fixed/relative bar group width
Control the Bar Width and Padding
You can now set the fixed bar width in pixels for an individual series:
series: [
  { valueField: "year2004", name: "2004", barWidth: 40 },
  { valueField: "year2001", name: "2001", barWidth: 20 }
],
Alternatively, you can use the padding-to-bar ratio to specify the relative bar width:
series: [
 { valueField: "year2004", name: "2004", barPadding: 0.2 },
 { valueField: "year2001", name: "2001", barPadding: 0.7 }
]
In both cases, whatever space is left is reserved for padding. Here's how the chart looks in the default configuration and with these settings applied:

Control the Bar Group Width and Padding
The width and padding of bar groups is controlled similarly to that of single bars. You can use pixel values to specify the fixed bar group width:
{
  ...
  barGroupWidth: 50
}
Here's how the chart looks in the default configuration and with these settings applied:

Or you can use the padding-to-bar group ratio to specify the relative bar group width:
{
  ...
  barGroupPadding: 0
}
Here's the chart when you set barGroupPadding to 0:

Other notable improvements
- Data aggregation has been completely revamped. Learn more by reading this blog post.
- The Chart's Point object now provides access to the data object it represents via the data field. With data aggregation enabled, the data objects are available via the data field in the aggregationInfo object.
- Scale breaks, introduced in v17.2, now can be used in a multi-axis chart:

Angular, Vue, React, ASP.NET MVC / Core and more
All of these new features will be available on all the frameworks we support: Angular, Vue, React, jQuery, Knockout, ASP.NET MVC and .NET Core.
Test It Today
If you want to give these features a test-drive then simply add DevExtreme to your project by adding this npm package:
npm install --save devextreme@18.1-unstable
If you're not using npm, check out my earlier blog post about pre-releases.
Join the Webinar
Sign up for our upcoming “New in v18.1 - DevExtreme HTML / JS Controls” webinar where you’ll have a chance to see all the new DevExtreme v18.1 items demonstrated live and ask any questions about our ASP.NET MVC, ASP.NET Core, React, Vue, or other client-side offerings.
Join the webinar: DevExpress Webinar: New in v18.1 - DevExtreme HTML/JS Controls
Like it?
We'd love to hear your feedback about the DevExtreme Charting improvements. Drop me a line below, thanks.
Email: mharry@devexpress.com
Twitter: @mehulharry